Overcoming the three biggest data accuracy challenges

Your experimentation program is only as good as the data behind it.
You need a robust testing methodology with a platform that accurately calculates statistically significant results.
Otherwise, you’re likely to make mis-informed test calls and money-losing mistakes.
In addition to how statistical significance is calculated and reported, there are three additional data accuracy challenges threatening today’s testing programs:
- Browser Privacy Regulations: that block and restrict accurate data collection.
- Sample Ratio Mismatch (SRM): which, when undetected or untreated, affects test results.
- Attribution windows: that don’t properly account for your sales cycles or business model.
When any of these problems occur, they threaten data accuracy. Unfortunately, many experimenters are unaware of these issues.
Yet, 40% of all A/B tests are thought to have data accuracy and data collection issues, according to Joris Bryon in his book Kill Your Conversion Killers.
Failure to address these problems threatens the credibility of your entire experimentation program.
To ensure you have the most accurate experimentation data, this article explains the challenges and best ways to overcome them -- so you can confidently get trustworthy, accurate results to make winning test calls without question.
Browser Privacy Regulations: that block and restrict accurate data collection.
Currently, one of the biggest challenges to experimentation is accurate data collection. It’s becoming increasingly difficult to fully track, gather, and report conversion data.
The reason is increasingly stringent privacy regulations.
You may already know, 3rd party cookies – which track, collect, and send user data – are being blocked or restricted on browsers, like Google’s Chrome and Mozilla’s Firefox.
What you might not have realized is, Apple is leading the way in 1st party cookie abolishment and consumer privacy protection.
Since 2017, it’s been quietly adding new privacy features known as Intelligent Tracking Prevention (ITP).
Given about 30% of Internet users are on an Apple device, or Safari browser, Apple’s ITP movement takes a substantial bite of marketer’s data tracking capabilities.
As this timeline shows, with each ITP update, accurately tracking user data becomes less feasible:
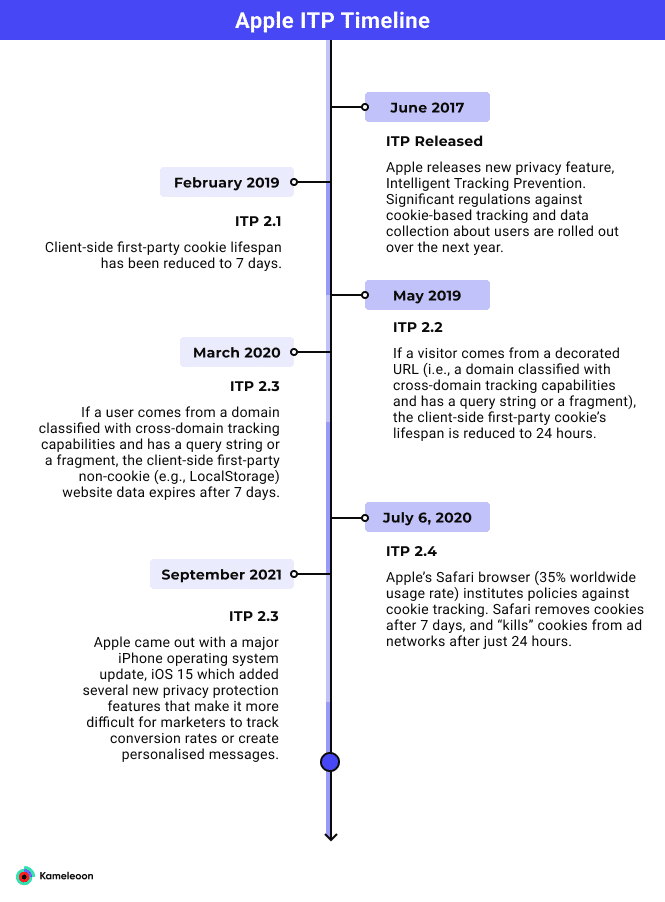
The end result is, it’s becoming much harder for experimenters to properly track users, monitor conversions, or make accurate data-driven decisions – all of which put pressure on your testing program.
What To Do About Tracking Prevention
However, there does seem to be a viable solution to overcome cookie constraints. It’s known as server-side tracking.
In server-side tracking, data is sent to a company’s privately-owned server infrastructure. This process removes the need to rely on cookies, but still allows for data collection.
Kameleoon’s Server-Side Snippet Solution
Kameleoon has developed a server-side solution that safeguards tracking data, even without cookies.
It’s a short snippet of code that you can simply install via an HTTP header.
The snippet creates a server-side cookie, with a unique visitor identifier, which ensures historical data about a user is saved so a visitor always sees the same variant of an experiment.
The snippet works on all browsers, including Safari, even if all cookies have been removed. It’s also both GDPR- and CCPA- compliant, and won’t slow your website.
You can learn more about the snippet here.
It’s recommended you install the snippet as soon as you onboard and start using Kameleoon. But, no worries if you haven’t done so yet. You can install the snippet anytime.
Click here to get the snippet and installation instructions.
Sample Ratio Mismatch (SRM)
Another major problem with data accuracy is a phenomenon known as Sample Ratio Mismatch (SRM).
SRM is like a silent killer in the testing world.
When undetected, or untreated, it can dramatically skew conversion numbers and invalidate your test results.
If SRM occurs, you may end up making money-losing calls on what you thought were winning experiments.
To avoid falling into this data-duping trap, you need to know not only what SRM is, but also why it’s important, and how to correct for it.
What is SRM?
According to a recent LinkedIn poll, 32% of marketers don’t know what SRM is:
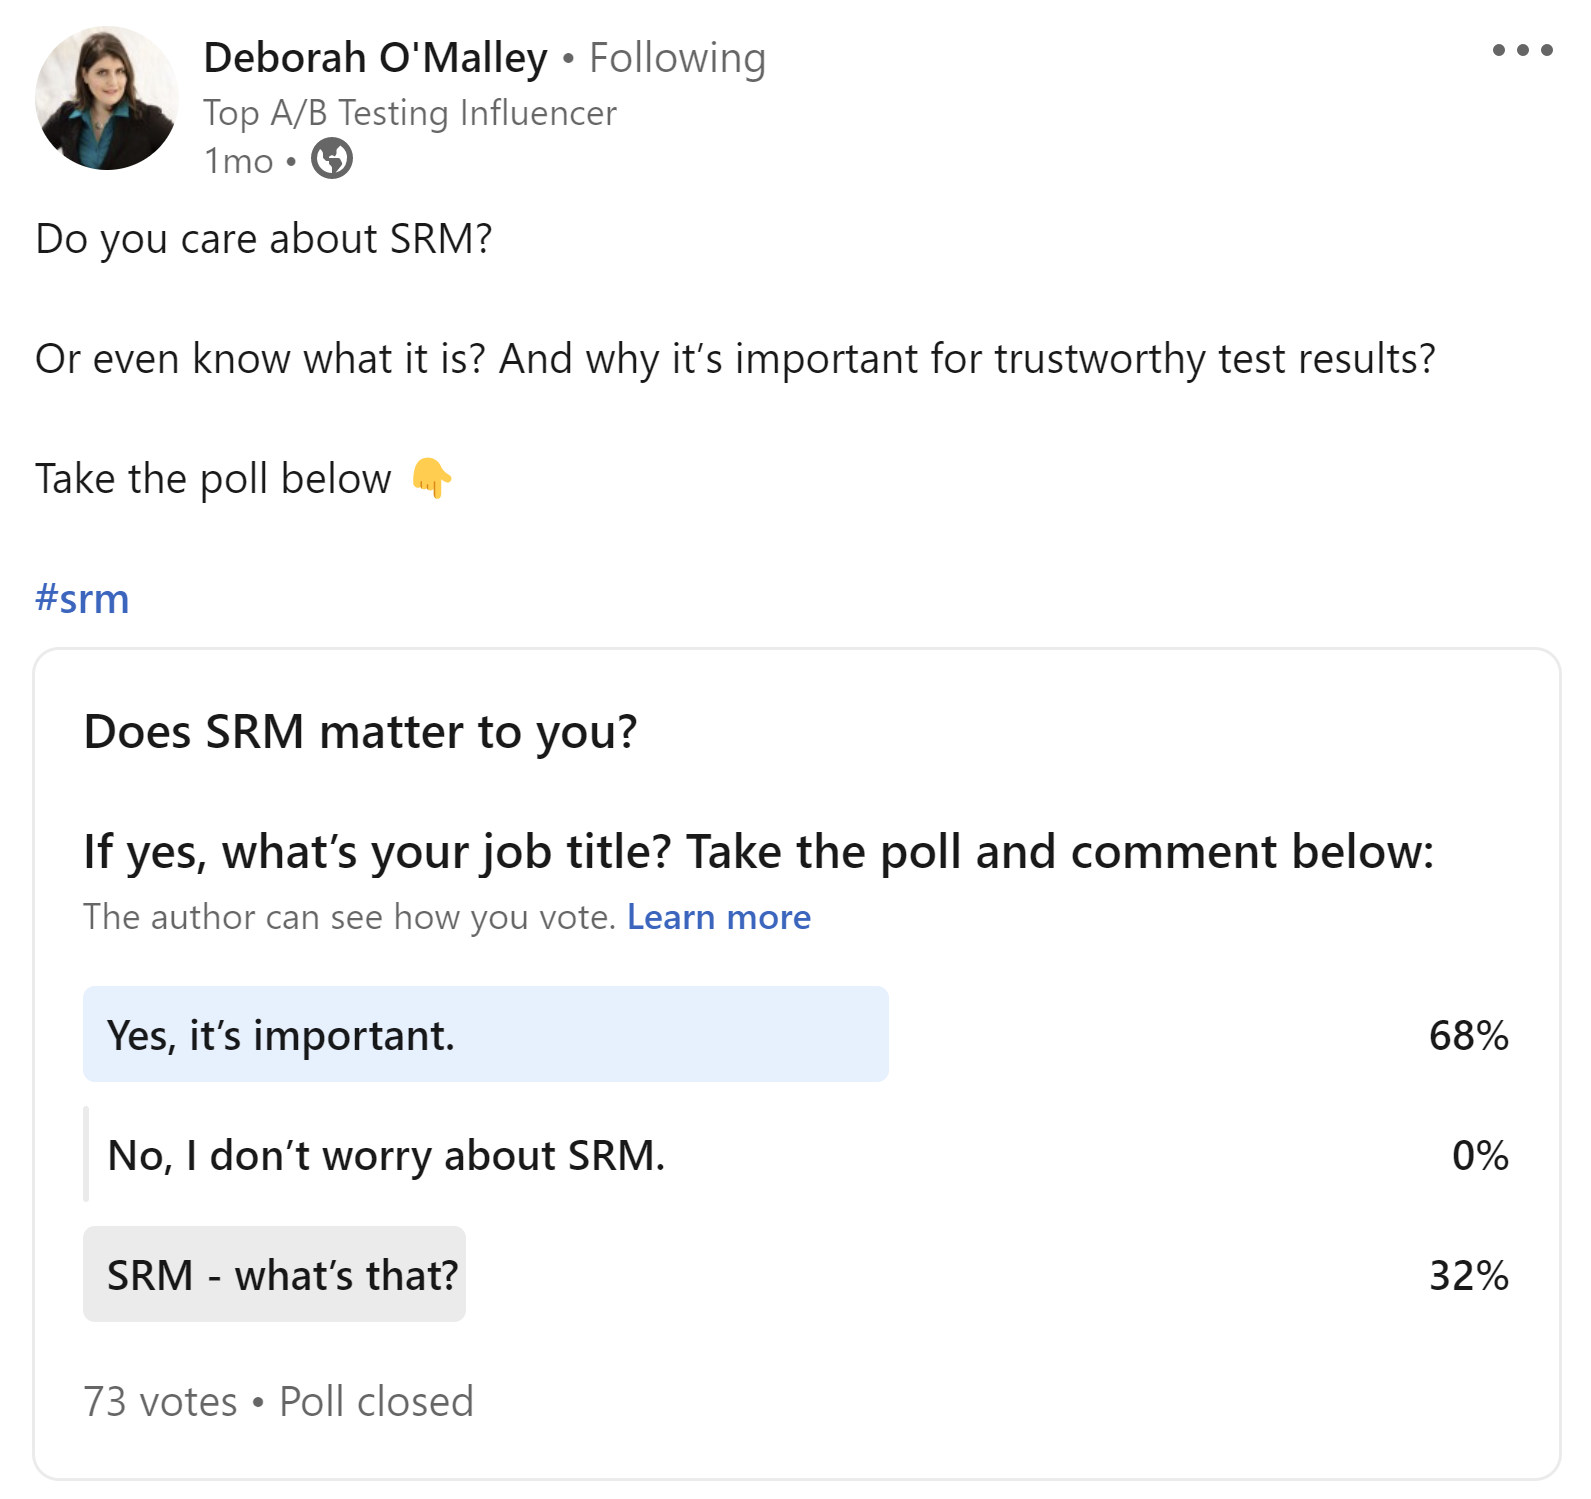
That’s a huge problem because if you don’t know what SRM is, you can’t be on the lookout for it. Here’s a simple definition:
As this article explains, SRM happens when test traffic is unevenly distributed and one variation unintentionally receives much more traffic than the other(s).
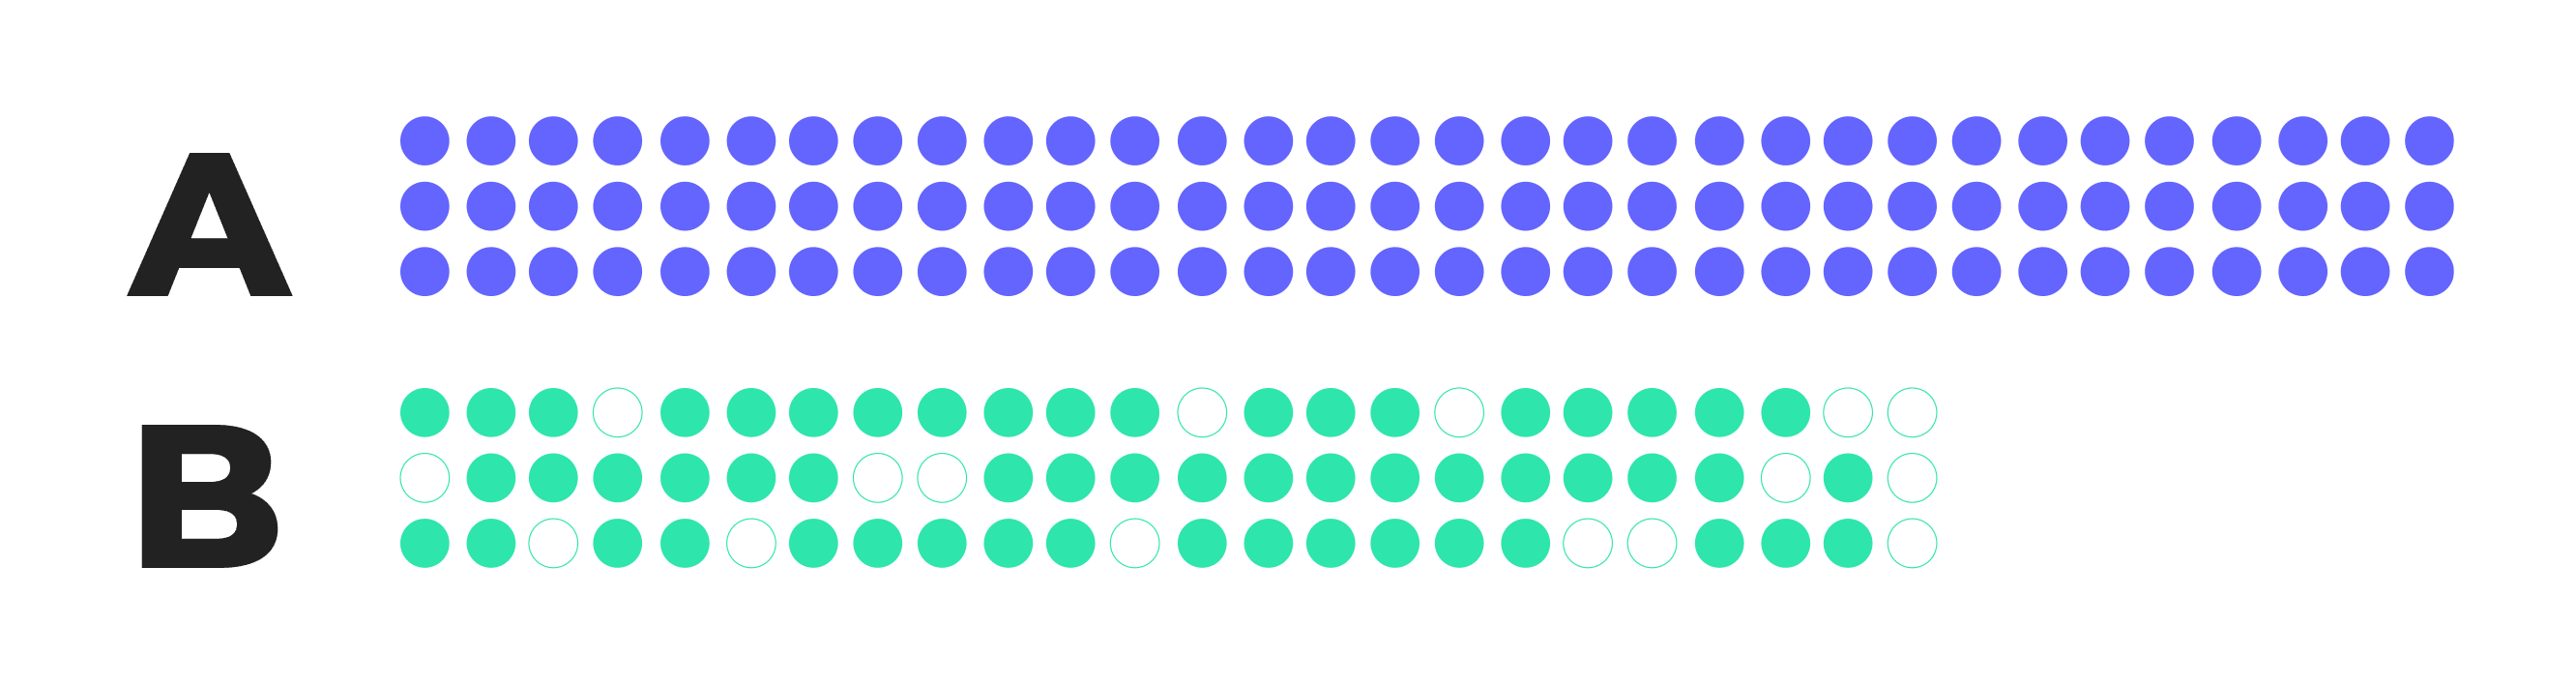
Normally, when running an A/B test, traffic is split 50/50 and looks something like this:

But, with SRM, traffic becomes unintentionally unevenly weighted so one variant ends up receiving disproportionately more users than the other.
With SRM, traffic distribution looks more like this:
This uneven weighting of traffic is highly problematic because it skews conversion numbers and data.
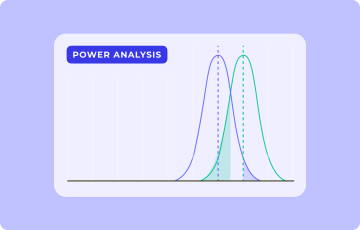
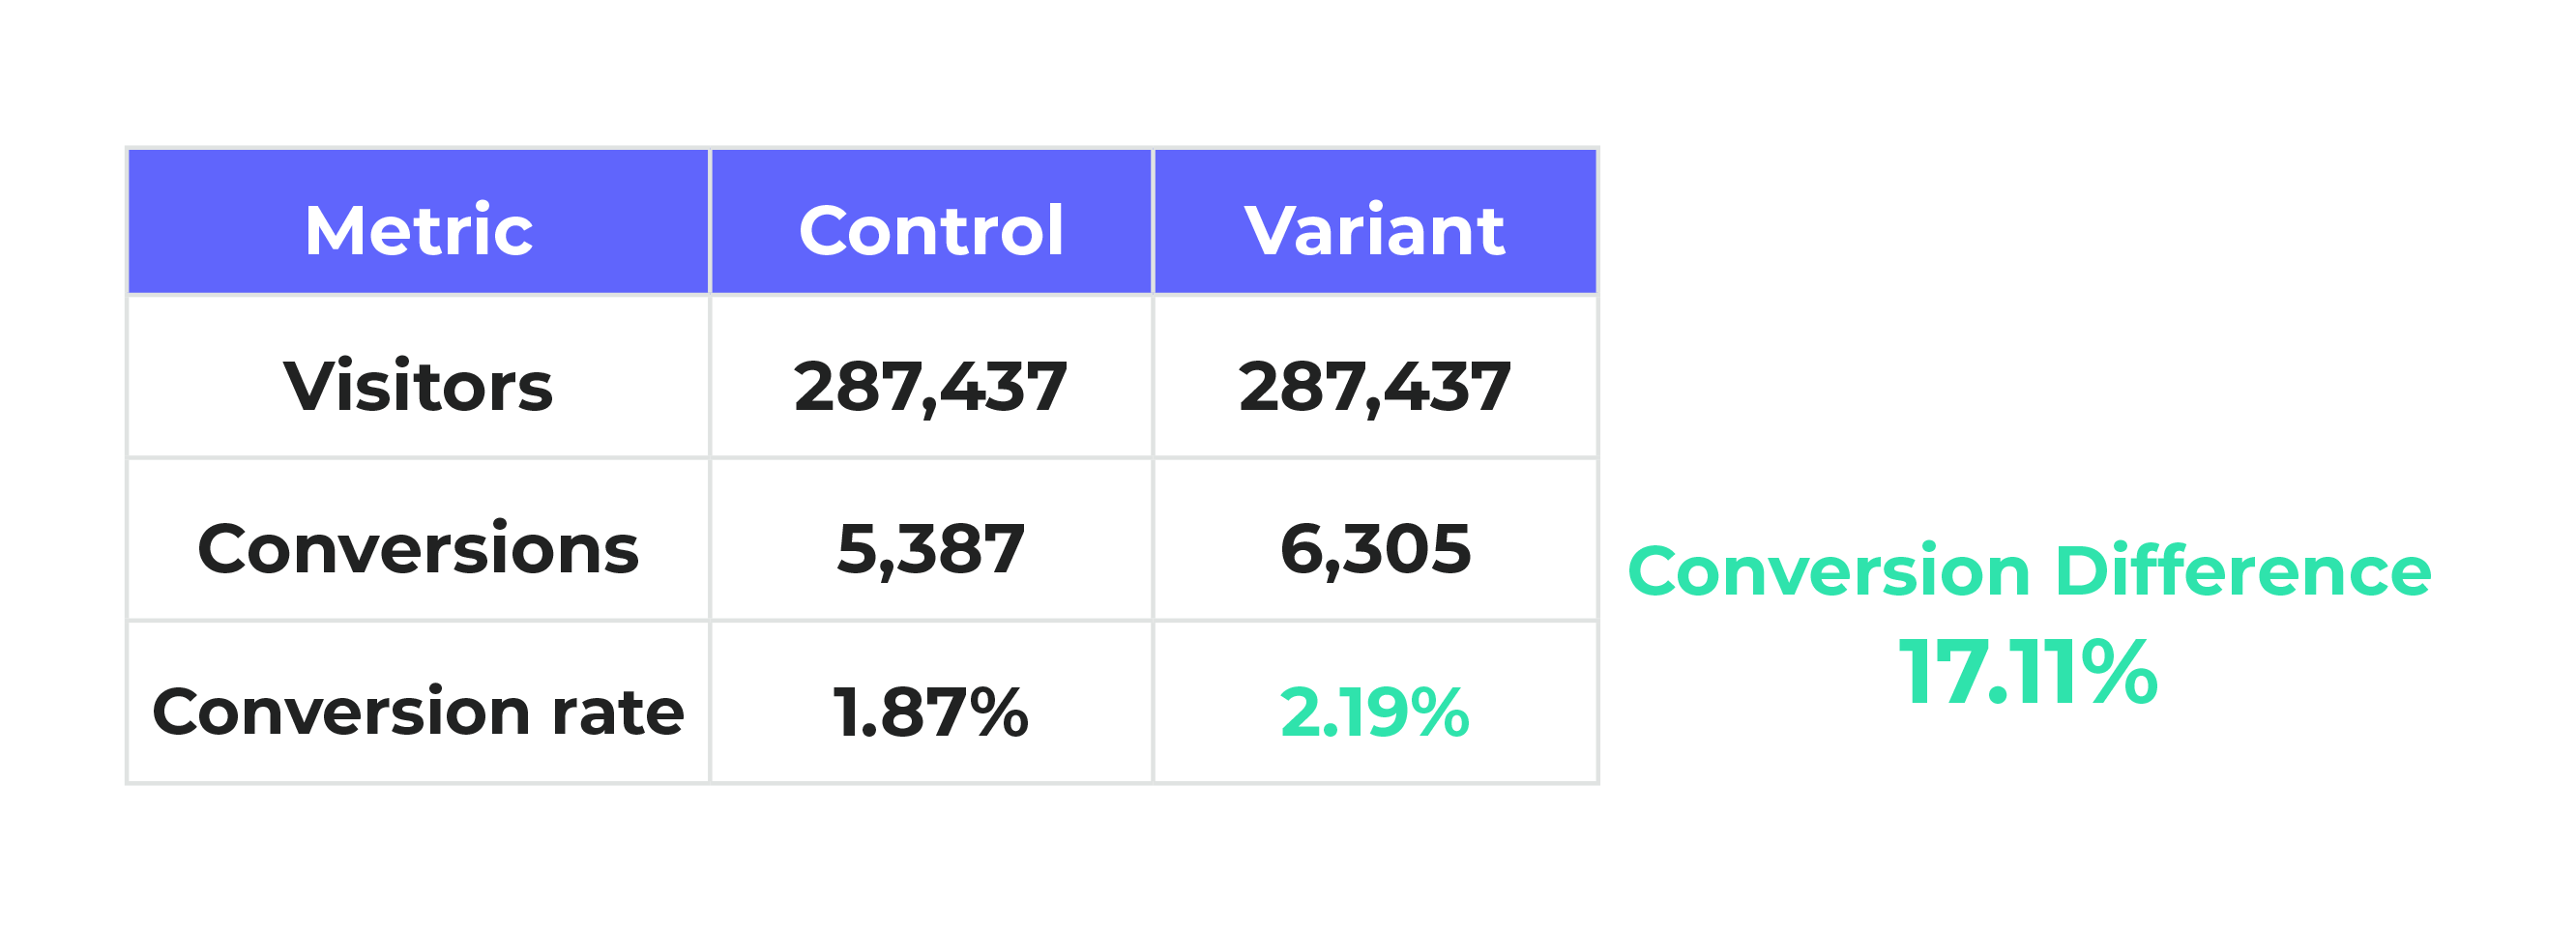
Take, for example, this real-life case study example which shows that, with equally split traffic, the variant outperforms achieving a +17.11% conversion lift:
But, with SRM, far more visitors are directed to the variant. Even though the number of conversions remains the same, the ratio of conversions to traffic is altered pushing down the variation’s conversion rate to a disappointing -11.06% drop:
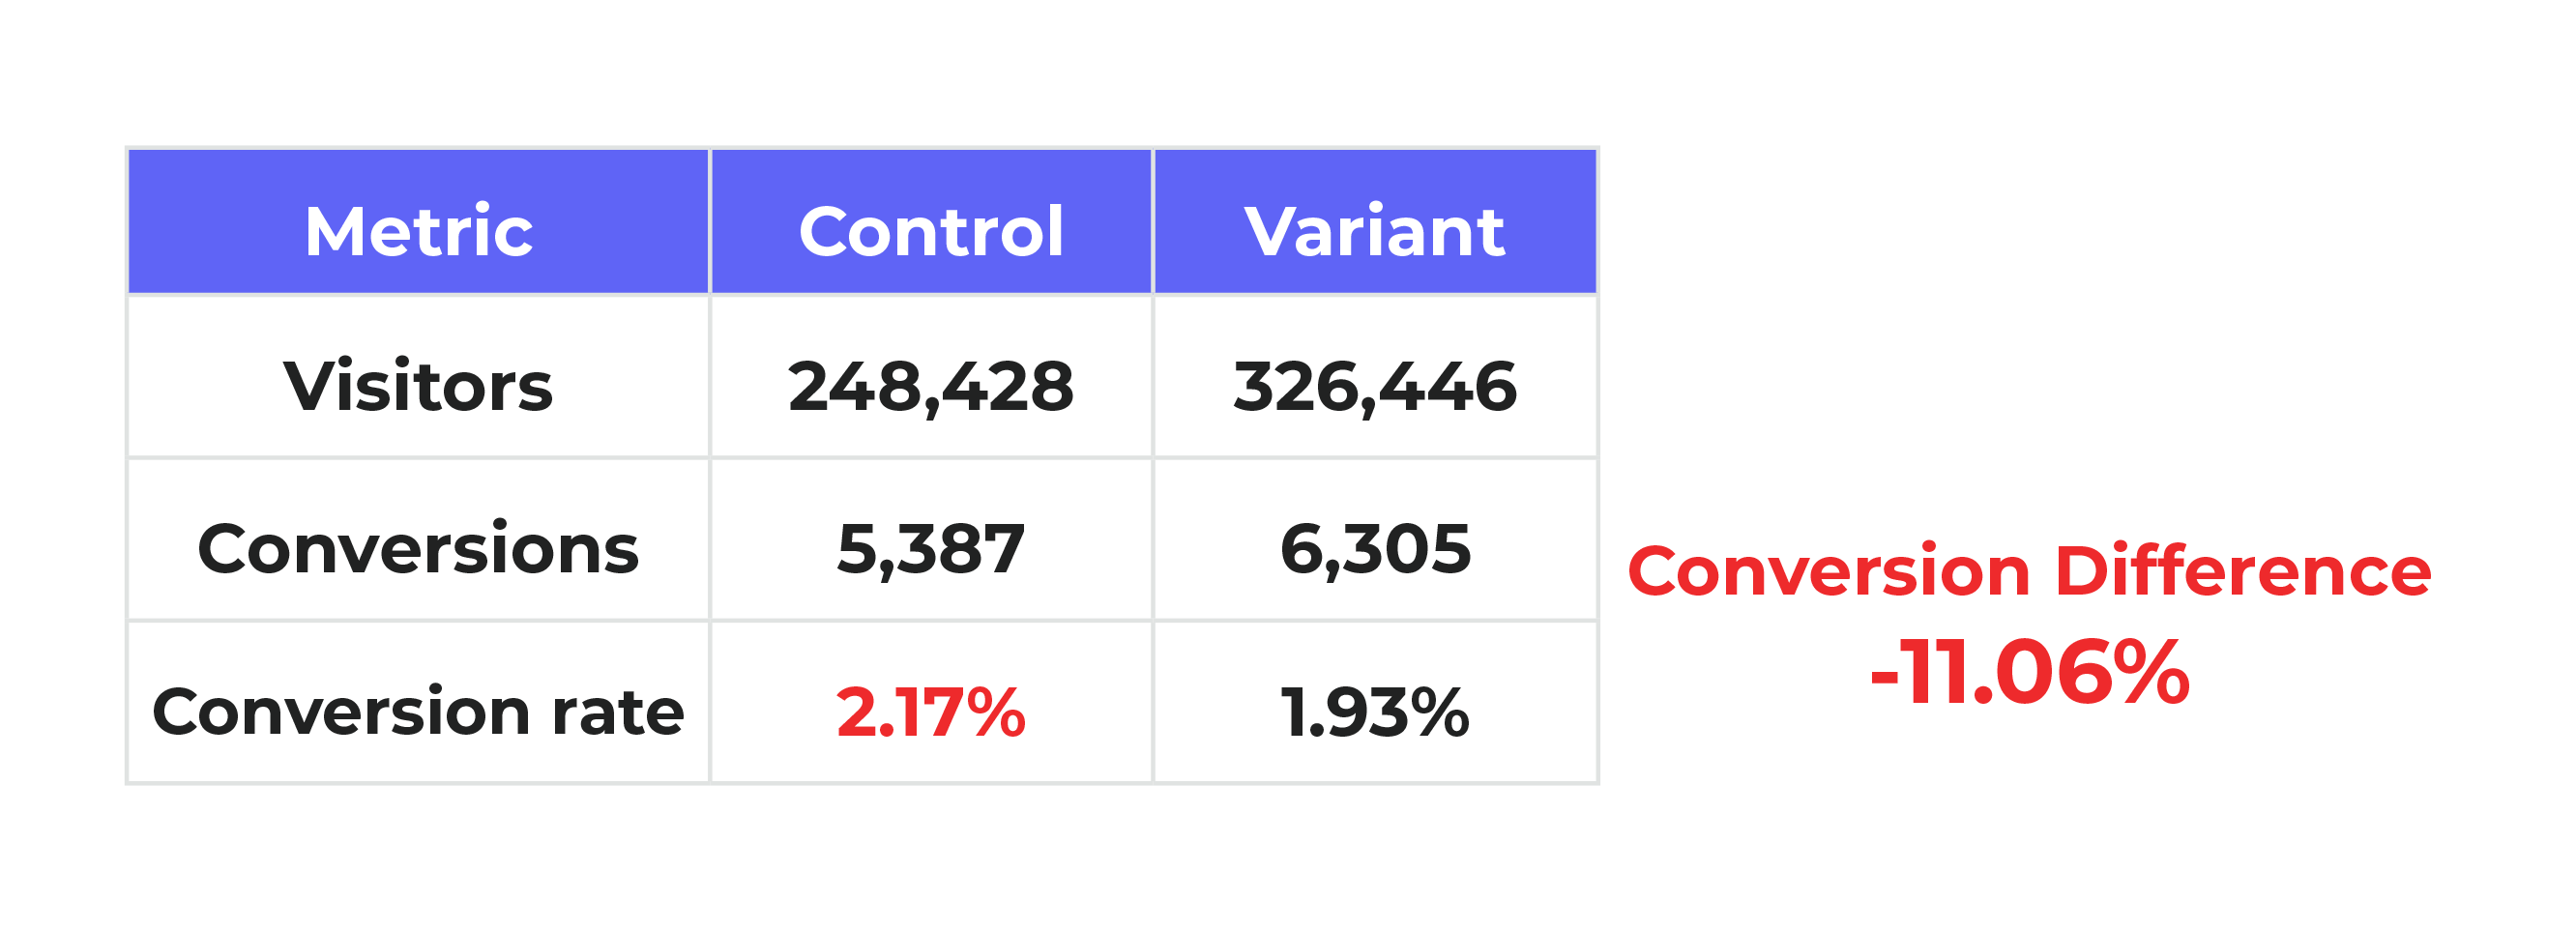
With SRM, the variation now appears a loser instead of winner.
Which variation actually won or lost? It’s really hard to say. The data is inaccurate. Which is exactly why SRM is such a big problem.
Catching SRM with Kameleoon’s In-App Notification
Now that you know what SRM is, you’re further ahead than over 30% of marketers.
But while awareness is important, knowing how to spot SRM, and what to do about it, is even more crucial.
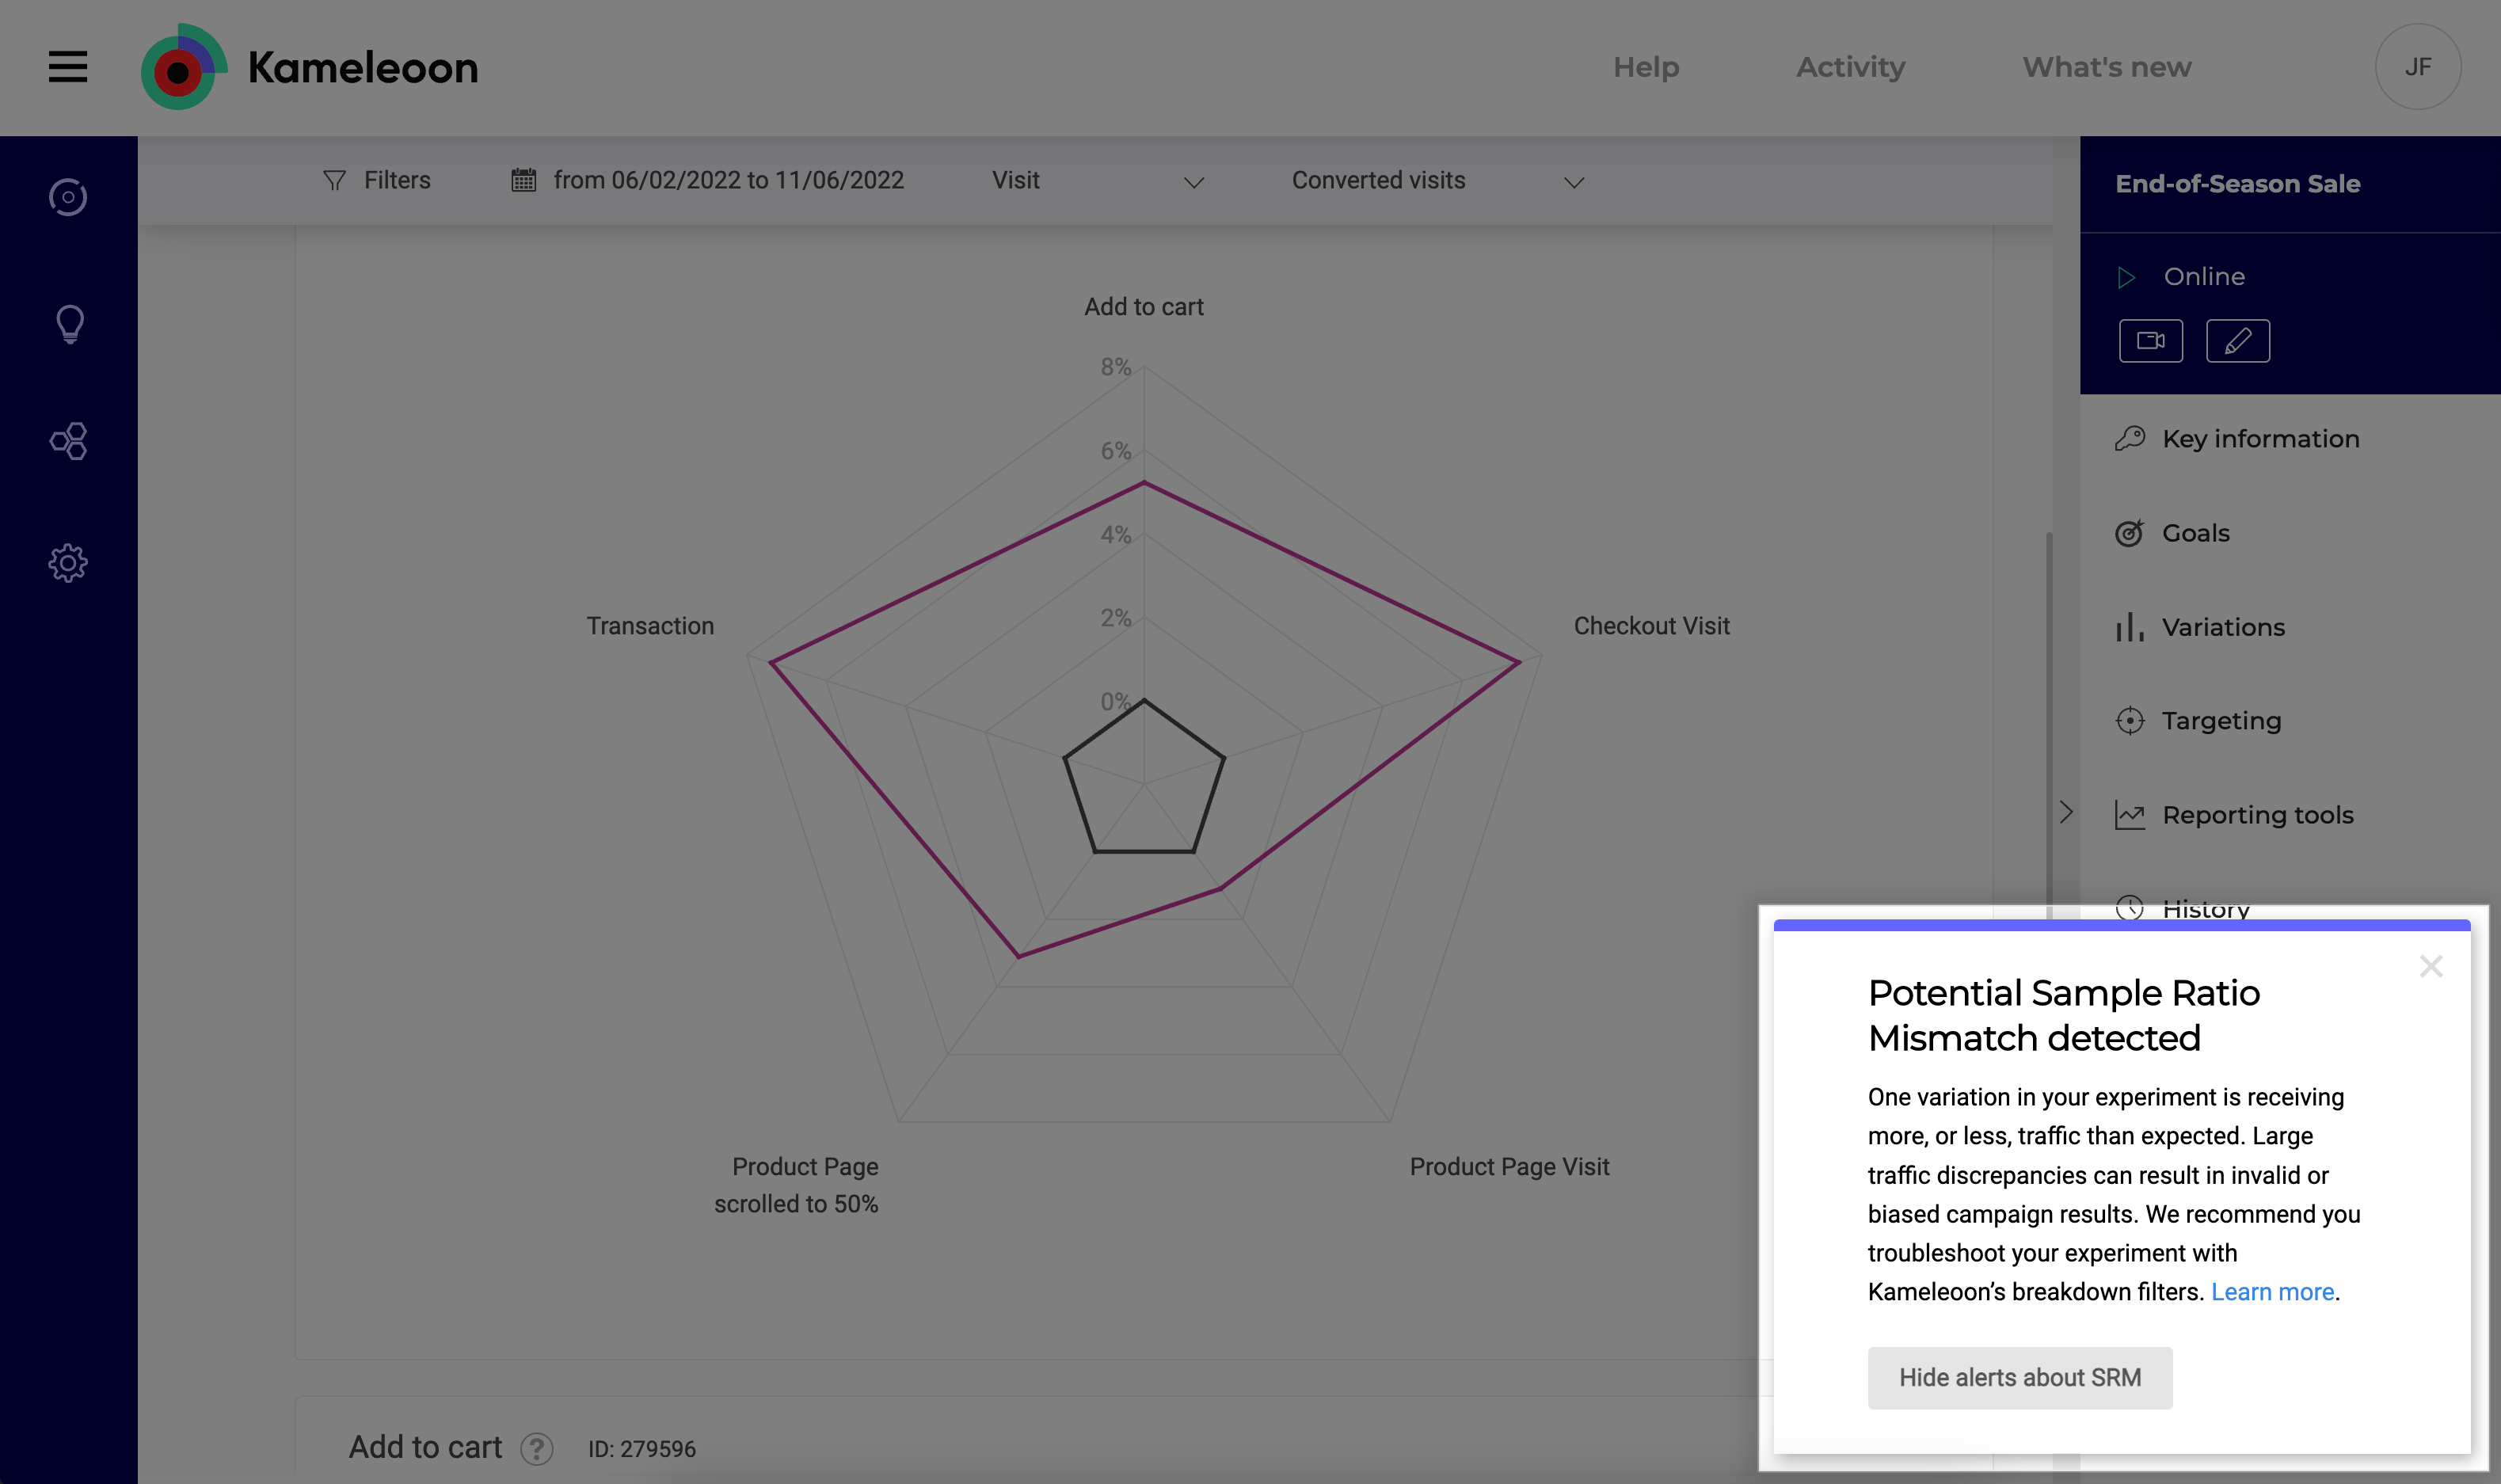
Kameleoon has developed an in-app notification alert that displays on any test you’re running in which SRM is suspected or detected.
The notification sits on the bottom right corner of your results screen and looks like this:
If you see an SRM alert, don’t worry. There are several measures you can take to identify and fix the culprit. To see some of the most common fixes for SRM issues, check out this help doc.
So, now, you never need to question if your test has SRM. Kameleoon will tell you. Which means, you can continue making winning test calls – without worry – knowing your data is truly trustworthy.
Attribution Windows
The third issue that jeopardizes data accuracy is a one-size-fits all approach to testing.
When experimenters take this approach, they risk inaccurately attributing conversions to an experiment without considering their organization’s unique sales cycle.
Think of it like this: when running an experiment, you, obviously, want to be able to accurately measure all conversions which occurred in the test time frame.
The problem is, the length of time you run the experiment may not be well-matched with your business cycle.
For example, you may run an experiment for three weeks, but it, typically, takes you six-weeks to nurture a lead before they convert.
This mis-match contributes to a major data discrepancy because conversions are not properly paired with users' behavior during the timeframe you’re measuring.
Add in seasonal effects, which may alter buying patterns throughout the year, or across different holidays, plus unpredictable factors like shifts in the economic environment, and it becomes nearly impossible to accurately measure and attribute conversions to a set testing time frame.
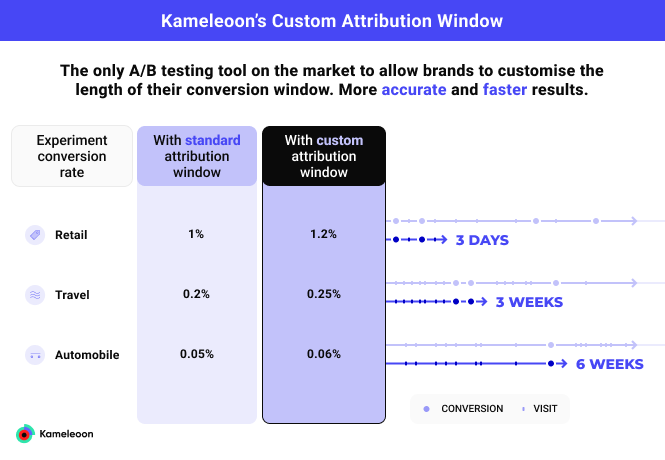
Kameleoon’s Custom Attribution Window
Kameleoon’s Custom Attribution Window, literally, throws all this uncertainty out the window.
Without changing test duration, experimenters can now easily customize exactly how long a campaign should be credited for affecting conversions.
Kameleoon is the first -- and only -- A/B testing solution to offer this customizable attribution timeframe functionality.
Having the ability to accurately set your attribution window is key because small shifts can make a big difference when it comes to accurately accounting for revenue and conversions.
For example, say you’re an online automobile retailer and run a six-week test using a standard attribution window. During this time, you may have thought you achieved a 0.05% conversion rate.
But, by setting your custom attribution window, what you actually find out is the conversion rate was 0.06%.
The difference between a 0.05% and 0.06% rate appears tiny, but in actuality, it amounts to a 20% gain.
When we’re talking about auto parts sold, for example, this difference could amount to thousands, or tens of thousands, of more dollars made during the time period.
How To Set Your Custom Attribution Window
Within Kameleoon, the Custom Attribution Window is formatted as a small checkbox.
Because it’s so unassuming, you might have missed it.
To take advantage of this powerful feature, all you need to do is go into your Admin panel and click into the Project tab. Then, choose the project you’d like to set the attribution window for.
Now, click into the Attribution Window setting and simply set your desired attribution timeframe.
The default time frame is 7 days, but you can easily customize by days, or hours, to meet your unique testing needs.
You can also change the attribution window for every experiment you run. And, you can run multiple experiments with different attribution windows.
And, once you’ve made updates, you can always confirm the settings on the right-side pane of your test.
Accurate Data is Essential for Trustworthy Test Results
Unfortunately, increasingly stringent browser privacy regulations, like Apple’s ITP, mixed in with SRM, and one-size-fits all attribution windows can all lead to faulty, incomplete data.
These factors can jeopardize the trustworthiness of your test results and, ultimately, the success of your experimentation program.
To overcome these challenges, you need a professional enterprise experimentation platform that overcomes these important, often overlooked, data accuracy issues.
To learn more about how Kameleoon provides experimentation teams with accurate data, visit our Data Accuracy page.