What is a power analysis?
When teams experiment without alignment, they are risking a strategic and statistical breakdown. They risk running tests that look rigorous on the surface, but are brittle underneath: underpowered, over-interpreted, or based on mismatched goals.
This isn’t just a technical problem—it’s a trust problem. If one team ships a test with bad data, everyone suffers. Worse, implementing results from an experiment with faulty results can negatively impact conversions.
This is why power analysis matters. It’s not just about getting your sample size right—it’s about earning trust in your results. In a world where marketing, product, and engineering all need to run experiments their own way, power analysis is the foundation of shared rigor.
Only 1 in 4 category leaders in 2025 say every team can run robust tests across platforms. Without alignment, trust breaks down—and brittle tests follow.
In this article, we will discuss:
- What is a power analysis?
- Why are power analyses important?
- How to perform a power analysis
- Performing a power analysis with Kameleoon
- Power analyses in all-team experimentation
What is a power analysis?
A power analysis is a calculation you can use to determine how likely your experiment is to detect meaningful effects. To run a power analysis, you need the following four components:
Your estimations may come from data you already own, such as the baseline conversions from your control treatment. For example, if you are running an experiment on a page that is already active on your site, you already know the number of conversions per month, the possible effect size, and the statistical power.
If you are missing one component—typically sample size is the tricky one—you can use the other three to estimate the missing variable.
Another way to view a power analysis is that it is a way of calculating the smallest sample size to ensure you correctly reject the null hypothesis—that there is a meaningful difference between the control and variation.
Using a hypothesis to guide sample size
When running an experiment, you always have a hypothesis. For example, your hypothesis may be that a newly designed checkout page would convert more customers than the current one. This hypothesis is your alternate hypothesis; your null hypothesis for this same experiment might therefore be “both the control checkout page and the redesigned checkout page would have the same conversion rate.”
For your checkout A/B test, a power analysis will tell you the sample size needed to detect a meaningful difference between the control checkout page and redesigned checkout page. Once you have this sample size, you can reject the null hypothesis—that there will be no change in conversion rates—when you run your experiment.
Why are power analyses important?
Performing a power analysis before your experiment is beneficial as it ensures you can avoid errors, allocate resources to experiments with meaningful impact, and improve your trust in the results of your test and its expected lift.
1. Avoiding type I & type II errors
When designing experiments, power analyses help you avoid type I and type II errors—that is, falsely seeing an effect that's not really there, or missing an effect that is.
Think about it this way: with the right sample size, you can confidently detect even small differences between your control and variant groups. This means you can properly reject the null hypothesis when you should, avoiding type I errors.
There is a relationship between type II error and statistical power. Beta (β) is the probability of making a type II error, and it has an inverse relationship with statistical power. So the more powerful your experiment, the less likely you are to miss real effects.
2. More trust in your experiment results
Running a priori power analysis before your experiment is like checking your car has enough gas before a road trip. When your experiment is sufficiently powered, you protect yourself from false positives and negatives.
Think of power analysis as quality assurance for A/B testing. When you have done your power analysis before your experiment, you can confidently trust what your result is telling you.
3. Improved distribution of resources
You know how different teams across your company are coming up with all sorts of hypotheses that they want to test? Unfortunately, you may not have the time or resources to test all those hypotheses. Power analysis helps you figure out which hypotheses are worth testing—some of them are going to need way more visitors and time than you actually have available.
In this way, power analysis can be a great experiment prioritization tool. With it, you can look at your current traffic and experiment duration window and know whether it is possible to test your hypotheses and get reliable results within your constraints.
Don’t forget: running client-side tests beyond 30 days is generally a bad idea. Cookies are typically cleared after a month, which means users who have already seen your treatments might see them again after the cookie clears.
How to perform a power analysis
As previously mentioned, power analysis is a relationship between four components: statistical power, threshold for significance (α), effect size (d), and sample size. If you can nail down three components, you can solve for the missing piece like completing a puzzle. You can estimate these factors by pulling from previous experiment data or digging into the analytics of your control page/screen.
Once you've figured out what statistical power you need, set your significance threshold, and you have a pretty good idea of the effect size you're looking for, you can plug these into an online sample calculation to receive your sample size.
Kameleoon’s power analysis calculator is a great tool to work out any of the components needed in your experiment.
Statistical power
Statistical power is the probability that you will correctly reject the null hypothesis. You can also describe power as the probability that you get a p-value less than 0.05.
For example, if you calculate the p-value of your checkout experiment and find it to be 0.02, your experiment has a high power and you can confidently reject the null hypothesis (that both checkout pages would have the same conversion rate).
On the other hand, when the p-value is >0.05, your experiment is underpowered and you cannot reject the null hypothesis, even if the data sets for both your control and variant have two different distributions.
For example, if in your checkout experiment your calculated p-value is 0.14, your experiment is underpowered and you cannot safely reject the null hypothesis.
Statistical power has an opposite relationship with Beta (β), which is the probability of making a type II error. The formula for power is often written as:
Power = 1-β
When power is kept at 80%, it means you have an 80% chance of not committing a type II error. Similarly, if power is at 90%, then your probability of not making a type II error is 90%.
Threshold for significance (α)
The threshold for significance is equivalent to alpha (α). This is the probability that you will register a type I error in your experiment. This threshold is often set to 0.05 (5% confidence) and implies that in every experiment you run, there is a 5% probability that your result is a false positive (type I error).
When testing a hypothesis, the changes you detect in your results might be because of randomness and not because the alternate hypothesis is correct. When you take those results at face value, you incorrectly reject the null hypothesis and commit a type I error.
To mitigate this, you set a significance threshold. The lower your threshold of significance, the lower the probability that you will register type I errors in your experiment and vice versa. For example, if you set the threshold of significance in your checkout page experiment at 0.15, the probability of registering a false positive is 15%.
Sample size
Sample size is a segment of the population required for you to observe a minimum detectable effect at a specified power level in your experiment. When running a test, your population may consist of page views, visitors, emails, or even sessions. Not every visitor/session is bucketed into your experiment—rather, a random portion of your total visitors are exposed to your treatments. That is your sample size.
Your experiment’s sample size is influenced by statistical power, threshold of significance, and effect size. Power and statistical significance have a direct effect on sample size. The higher the power and statistical threshold, the larger the sample size. If your power is at 80% with a statistical threshold at 0.05, the sample size you need in that experiment would be high in order to meet these standards for avoiding type I and II errors.
Effect size has an inverse influence on sample size. The larger your sample size, the smaller the effect size and vice versa. It is worth noting that larger sample sizes also reduce the time it takes to run your A/B tests, but it’s a good idea to run your experiment for a full business cycle to ensure the detectable effects are statistically significant.
Effect size (d)
During your experiment, you may detect a difference that is past your threshold of significance, but may nevertheless not be useful in making business decisions. Say your control has 100 conversions and your variant checkout page has 120 conversions at the end of your experiment. Assuming the results are statistically significant, this change you have detected still may not be particularly useful in deciding if the effect is actually real.
This is where effect size comes in. Effect size tells you how meaningful the detectable difference between your treatments is. By calculating effect size to a standard metric, you can compare how well your treatments performed against an outcome, enabling a uniform evaluation of each treatment’s performance.
Minimum detectable effect (MDE) is the smallest effect size that you can reliably identify at a given confidence level and specified significance threshold. MDE helps you understand the smallest meaningful effect you can confidently detect at your chosen sample size, statistical power and significance level.
To calculate your MDE, you need to know your weekly traffic, conversions and the number of variants you plan to test. You can calculate your MDE using Kameleoon’s MDE calculator.
For example, imagine your weekly traffic is 15.8k, weekly conversions are at 850, and you plan to run two variants in your checkout experiment:

The Kameleoon MDE calculator lets you know the smallest acceptable increase in conversions for your testing parameters based on the length of the test. In this example, a test run over four weeks must see more than 9 new conversions in that time to meet your effect size requirements.
Performing a power analysis with Kameleoon
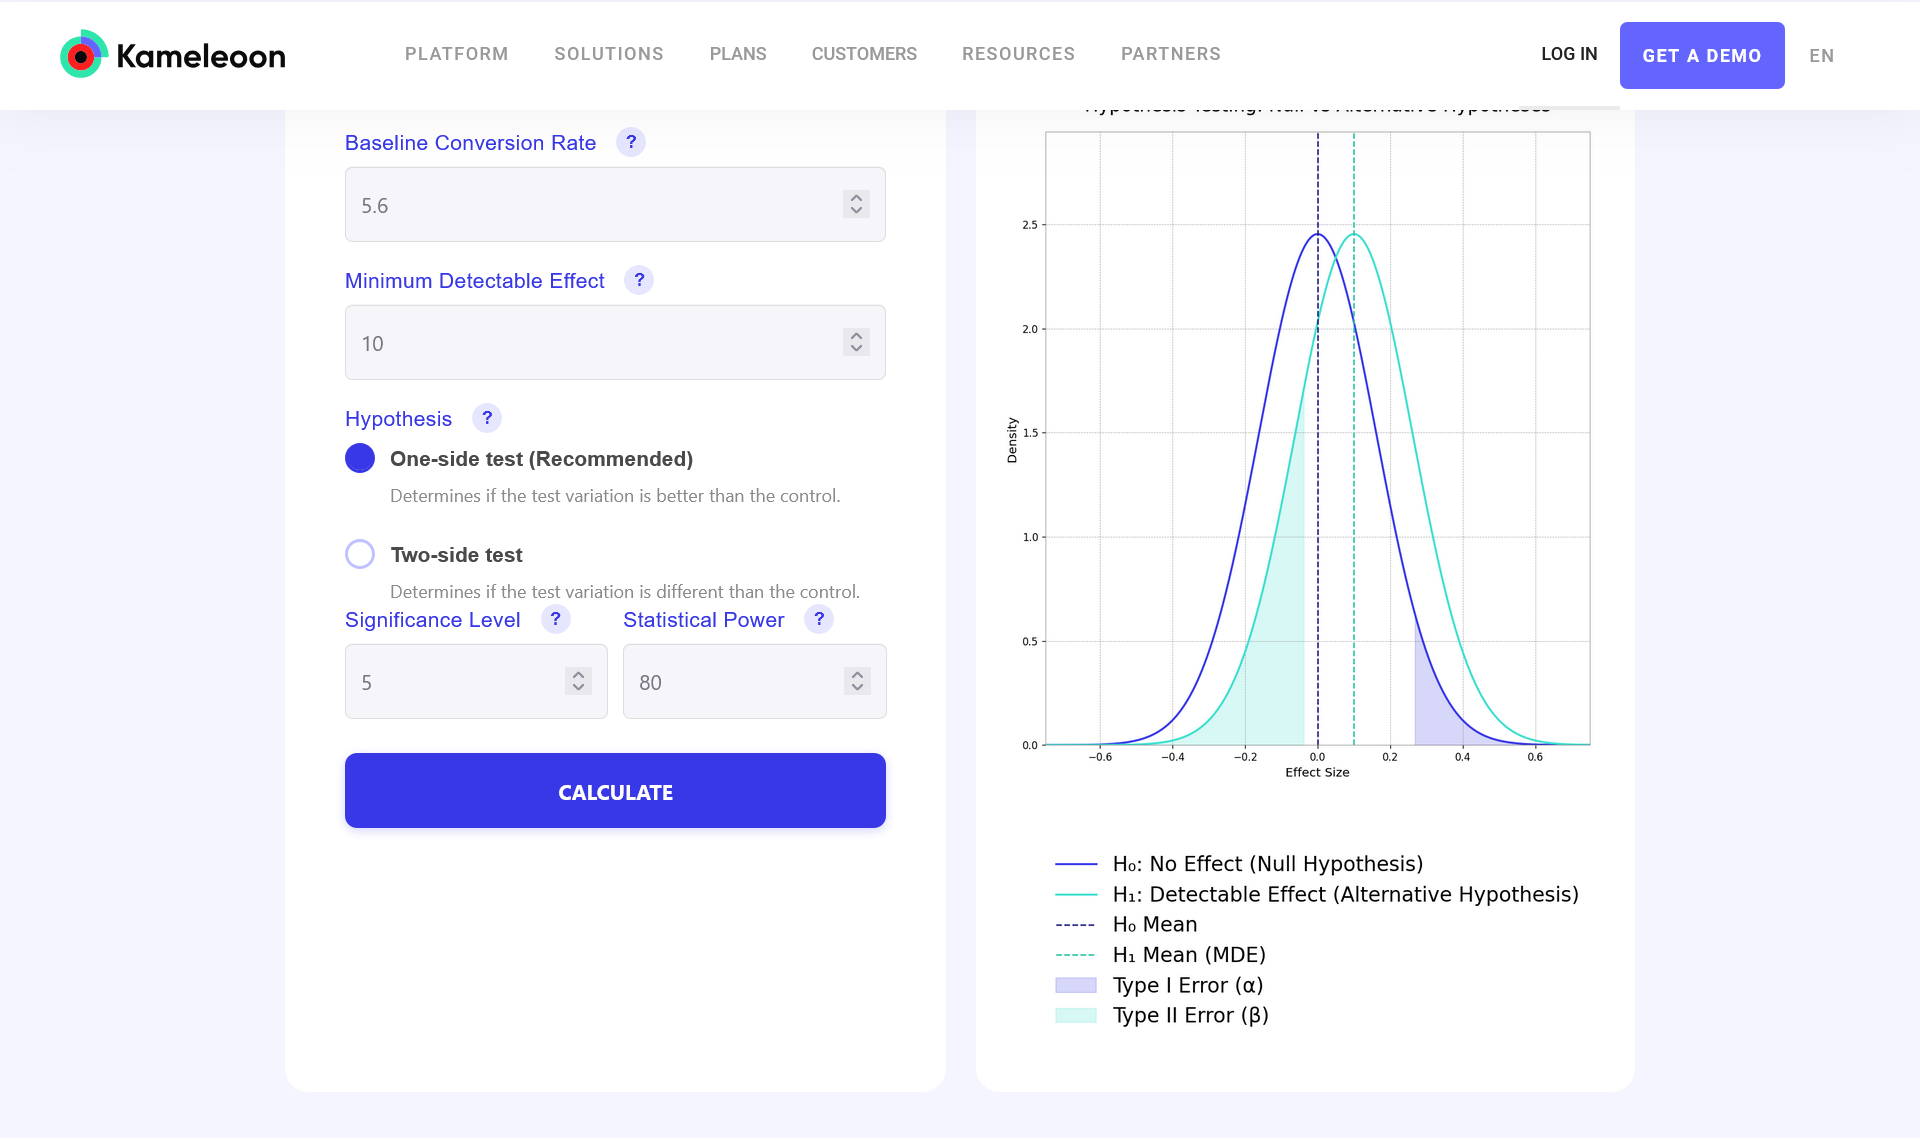
Kameleoon has a free A/B testing calculator that includes a sample size and duration, MDE, and power analysis calculators.
On the Kameleoon A/B testing calculator page, start with your MDE calculation. Plug in weekly visitors to your page, baseline conversions on the control page and the number of variations as shown above.
To perform a power analysis, plug in your MDE, baseline conversions and choose whether your experiment is a one-sided or two-sided test.Choose your significance and statistical power, then click calculate.
Power analyses in all-team experimentation
When your whole company is running experiments, power analysis isn't just some statistical nice-to-have. It is a game-changer for ensuring your tests deliver accurate, meaningful results. Here is why it is so valuable across your organization:
- It helps you standardize how everyone approaches A/B testing. Think of it as creating a shared playbook that all your teams can follow to design statistically sound experiments that can actually detect meaningful differences—not just random noise.
- Power analysis creates a shared methodology across different departments. When Marketing, Product, and Engineering are all speaking the same experimental language, those organizational silos start breaking down. Everyone can discuss experiment design and compare results using the same framework, which makes cross-departmental collaboration so much smoother.
- It prevents wasting time and budget. Power analysis helps you avoid both underpowered tests (where you might miss real effects) and overpowered ones (where you're using more resources than needed). It significantly reduces statistical errors, so you're much less likely to draw the wrong conclusions from your testing program.
Power analysis is not just another statistical tool—it is your secret weapon as an optimizer. It shields your experiments from false positives and negatives that can derail your experiment and its conclusions. It gives you confidence that your conclusion from your results is accurate and boosts your treatments’ ability to detect meaningful real-world changes that actually move the needle.
Want to ensure your next test is statistically sound? Try Kameleoon’s power analysis calculator—or speak with our team to begin building a shared experimentation playbook across your organization.