The 12 Kameleoon days of Christmas: part 1
At Kameleoon we believe in looking after our customers, particularly during the holiday season. So, over the next 12 days we’re going to run a series of blog posts that share some of the most powerful but unknown features of our personalization and experimentation platform. These are all designed to help save users time and make your life easier - once you’ve tried them you won’t look back. Think of it as an early Christmas present!
For day 1 we’re going to focus on how we make it easy to track changes on a page - a feature that makes it easier for large teams who work with Kameleoon.
1 Visualization of modified/tracked elements on a page
Particularly in larger organizations, keeping track of what has been changed on a page can be difficult. Different team members can be working individually on particular areas of a given experiment, making significant numbers of changes. This means it isn’t always easy to see what has been done using the history panel feature of the graphic editor, as it is time-consuming to look individually at each change to understand activities.
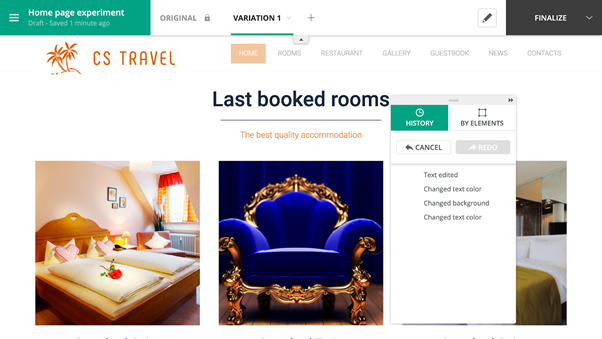
You can overcome this challenge by ticking the Tracked elements and Edited elements boxes under the Display tab of the General set-up menu in the graphic editor:
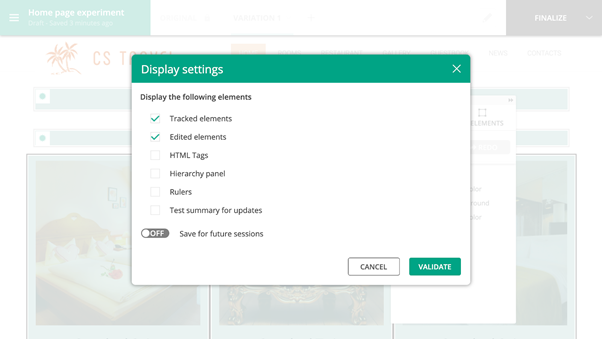
This adds this specific icon to every tracked item, enabling you to find them at a glance or make sure that the tracker has been set up.

A new icon appears next to every element that is edited, allowing users to see where changes have been made.

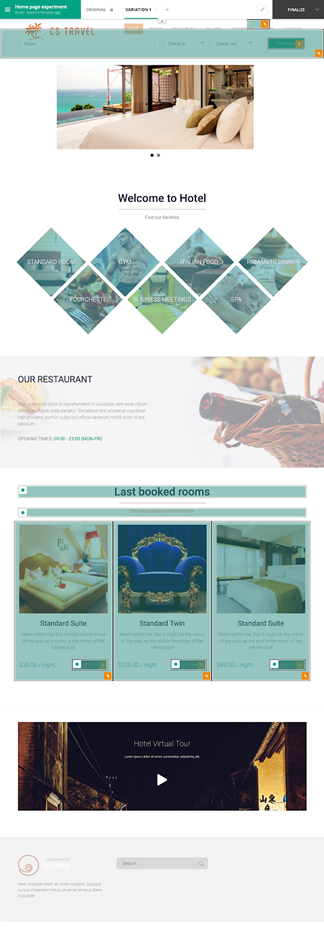
The result is that any user can easily monitor tracked and edited items and see where changes have been made - whatever the number of experiments running or the size of the team. Find out more in our technical documentation here.
Download a guide to all 12 features by clicking on the banner or check out individual blogs through the listing below

Read more in the series here:
- Day 1: Visualization of modified/tracked elements on a page
- Day 2: Reallocating traffic in case of issues
- Day 3: Simulation mode: visit and visitor generator
- Day 4: Click tracking: automatically send events to analytics tools such as Google Analytics
- Day 5: Adding a global code to an experiment
- Day 6: Excluding time periods from results
- Day 7: Measuring confidence stability
- Day 8: Switching to custom views
- Day 9: Using custom data for cross-device reconciliation
- Day 10: Personalization campaign management
- Day 11: Adding CSS selectors
- Day 12: Changing hover mode


