The 12 Kameleoon days of Christmas: part 8
Understanding your data is key to taking the right decisions on your experimentation and personalization results. However, given the range and number of KPIs and goals that can be set and monitored, ensuring that you are able to easily see and analyze your results can be difficult.
To help users better see the wood for the trees when it comes to data, today’s Kameleoon technical tip explains how you can customize how your results are displayed, at the click of a mouse.
1 Switching to view by variant
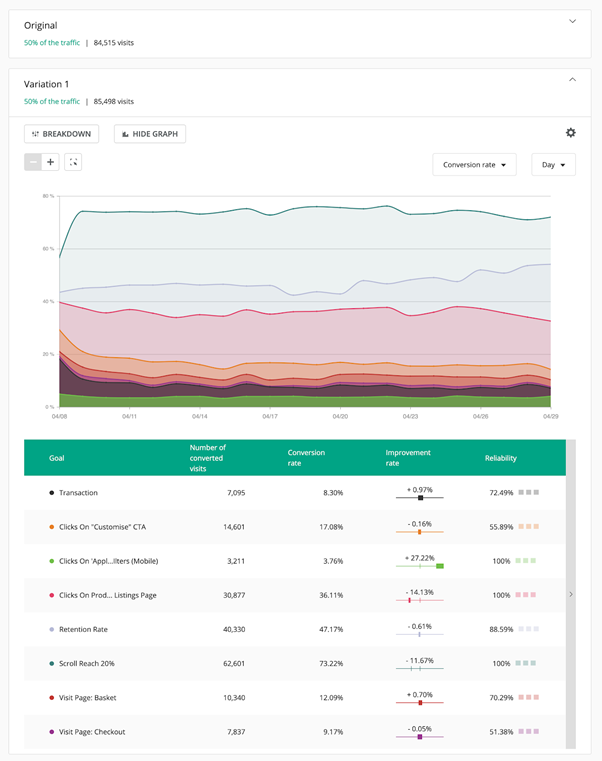
Traditionally your results dashboard displays one box for each KPI that you are measuring in your experiment. That means that if the experiment has a lot of KPIs or goals it has a lot of boxes, making it difficult to read and understand the results.

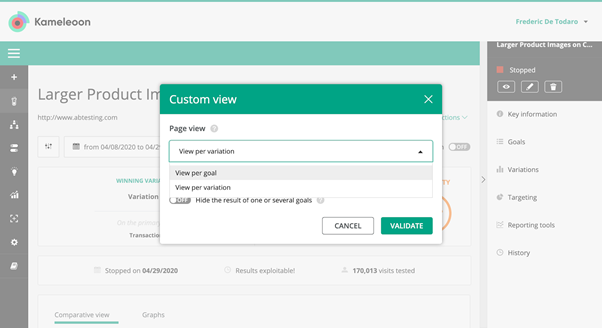
With Kameleoon you can completely change and customize your view. Instead of a separate box for every KPI you can switch to viewing by variant, modifying how all results are presented in graphs and tables.

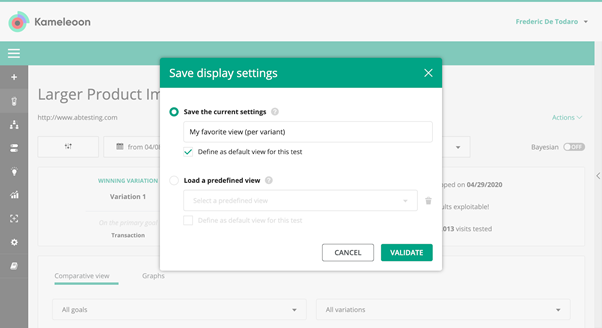
This makes it much simpler to visualize your results and understand the impact of each variant in the experiment. You can then set this as your default view so that you always see results in the way that best meets your needs.

If you like this view, you can even save it as a template and make it the default view for all your experiments, again..with a click of the mouse!

Learn more about how to create a custom view here - and come back tomorrow to find out how Kameleoon delivers omnichannel cross-device reconciliation for your experiments and personalizations.

Read more in the series here:
- Day 1: Visualization of modified/tracked elements on a page
- Day 2: Reallocating traffic in case of issues
- Day 3: Simulation mode: visit and visitor generator
- Day 4: Click tracking: automatically send events to analytics tools such as Google Analytics
- Day 5: Adding a global code to an experiment
- Day 6: Excluding time periods from results
- Day 7: Measuring confidence stability
- Day 8: Switching to custom views
- Day 9: Using custom data for cross-device reconciliation
- Day 10: Personalization campaign management
- Day 11: Adding CSS selectors
- Day 12: Changing hover mode


