What Sample Ratio Mismatch (SRM) is and what to do about it
As an experimenter, you’ve likely come across the term Sample Ratio Mismatch (SRM). And you’ve probably heard it’s a big problem you need to watch for when running A/B tests. But you may still be left wondering: what exactly is SRM? And why is it so bad, anyway?
Simply stated, in A/B testing, SRM occurs when test traffic is unevenly distributed and one variation unintentionally receives much more traffic than the other(s). The reason why SRM is so problematic is because it can dramatically skew conversion numbers and invalidate test results.
Big time!
So much so, in fact, that you can end up making money-losing calls on what you thought were winning experiments. To avoid falling into this trap, you need to check for SRM and attempt to remove, or filter it out, from your experiments.
How?
This guide details the do’s and don’ts of SRM so you can steer clear of it and, instead, achieve data accuracy and trustworthy test wins.
Let’s dig in. . .
What is Sample Ratio Mismatch (SRM) anyway?
To start, it can be helpful to wrap your head around the term itself. Sample Ratio Mismatch (SRM) sounds really complicated. It has all these complex words wrapped into one. But if you break it down into its three components, Sample, Ratio, and Mismatch, the concept is actually quite simple.
Sample
In A/B testing, the word sample describes the way traffic is allocated.
Equally split
Usually, in an A/B test, traffic is equally split 50/50. Half of visitors see the original, or control, version and the other half the variation.
Visually, an equal traffic split looks like this:

Equally split with multiple versions
You can also run experiments with several variations. For example, traffic might be equally allocated across 3 variations. In this case, the sample would be split 33/33/33, like this:

Unequally allocated
Although not a best practice because data can become inaccurate, traffic can also be unequally allocated across any number of variations. For example, in an A/B test, it can be divided 80/20 with 80% of visitors directed to the control and just 20% to the variation, like this:

Ratio
Despite how traffic is allocated across variations, if the sample is unintentionally routed so one variation receives far more visitors than the other(s), the traffic ratio becomes unequal.
Mismatch
This unequal ratio results in a mismatch between how you intended your sample of users to be divided and how they were actually allocated.
In A/B and multi-variant testing, the way traffic was split at the beginning of the study must stay consistent until the end.
Otherwise, you have a SRM issue.
When SRM occurs, traffic is much more heavily weighted to one variant. The outcome looks something like this

Here, you can see, by the empty green dots and shorter line, version B has received disproportionately fewer users than version A.
When this outcome occurs, test results can’t be fully trusted because the uneven distribution of traffic skews conversion numbers.
How does SRM play out in a real-life testing scenario?
Take this example from a real-life SaaS platform. Their testing team ran an A/B test in attempt to improve lead generation conversions.
But take note because this example can just as easily be applied to any eCommerce company selling products.
Traffic split without SRM
In this case, an A/B test was run with traffic equally split, 50/50. The test ran for 3 weeks achieving a large sample of 574,874 visitors.
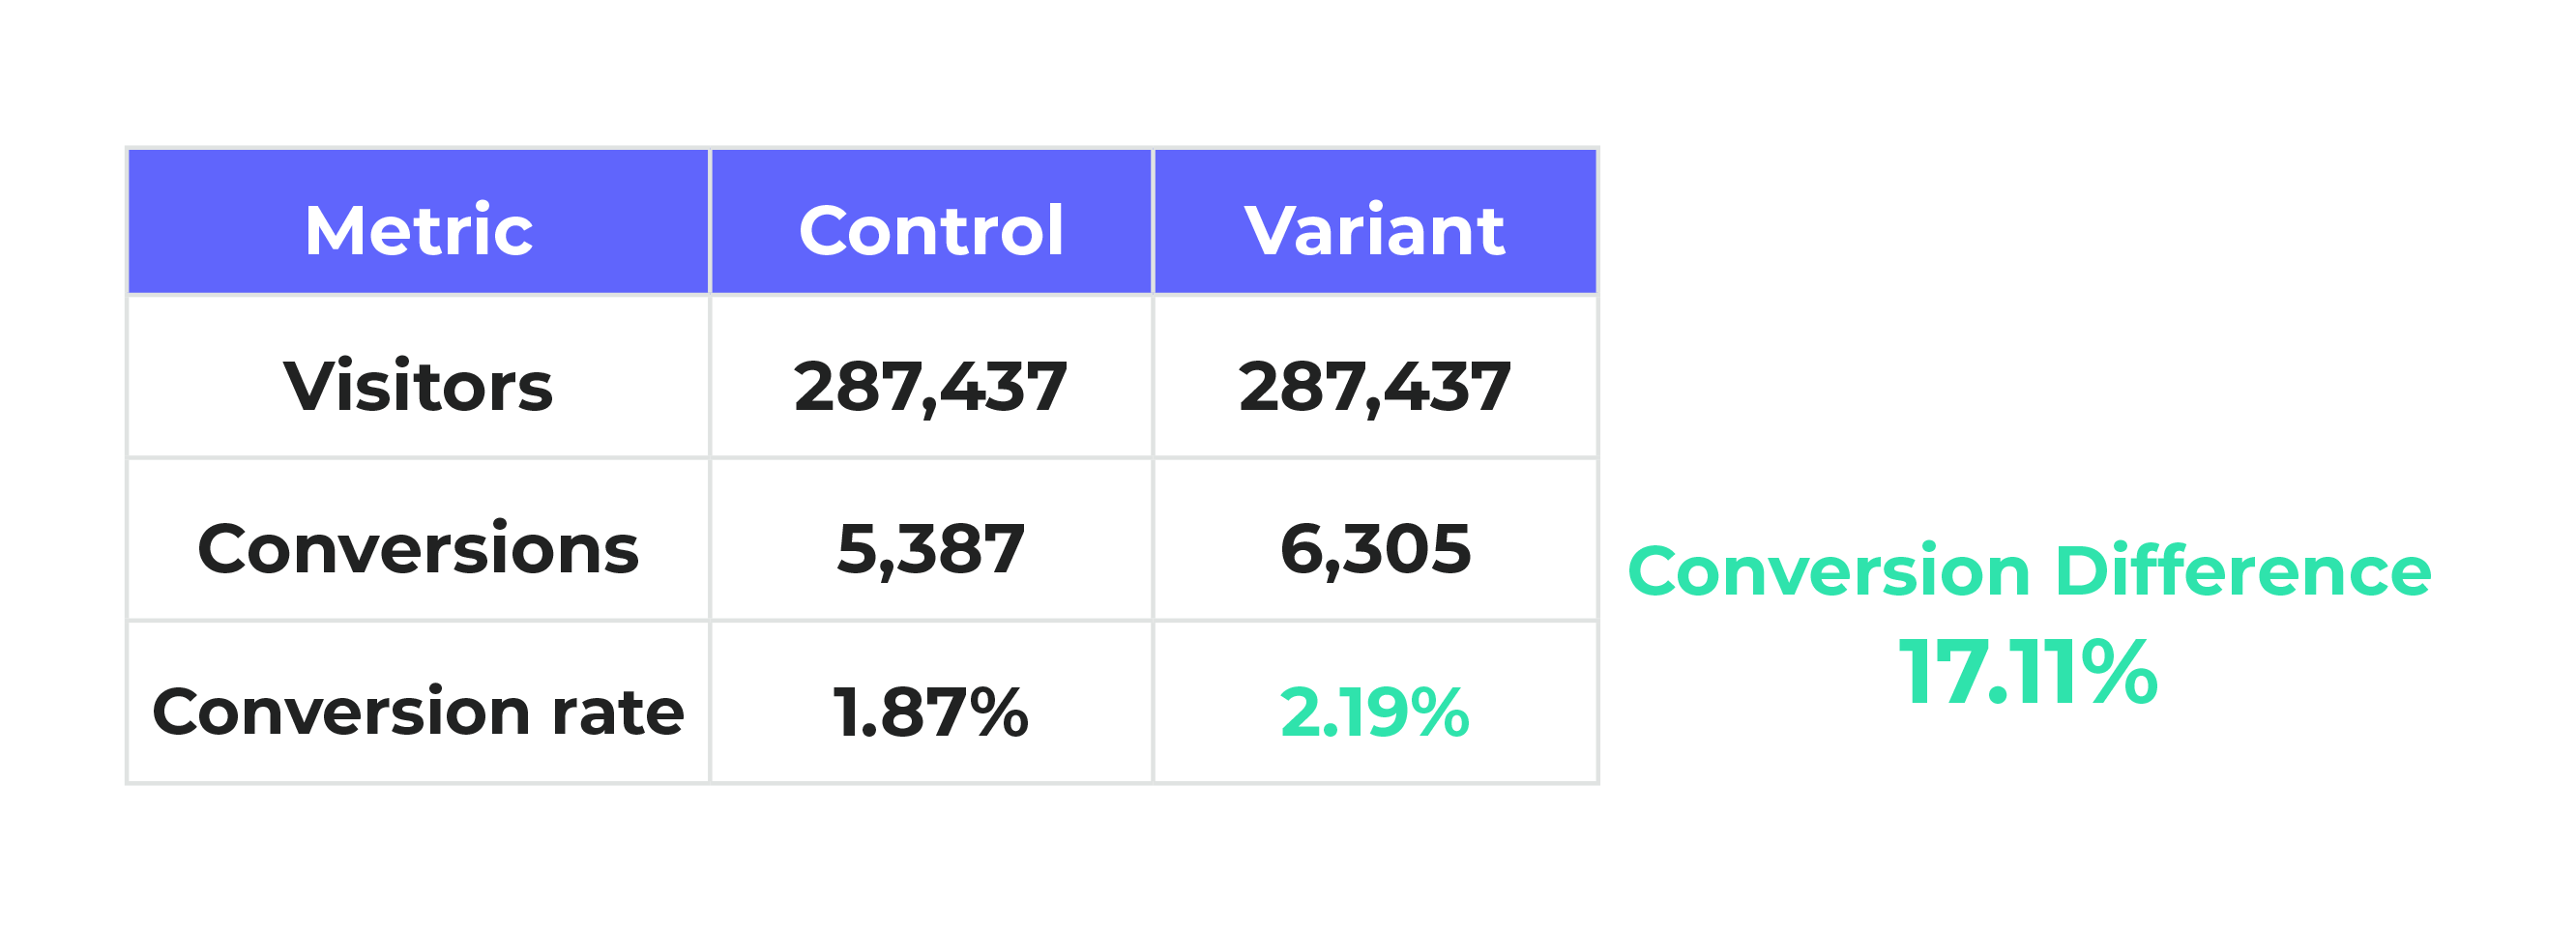
At the end of the experiment, it would have been expected that, based on this 50/50 split, each variation should have received roughly 287,437 visitors (574,874/2=287,437):

Traffic split with SRM
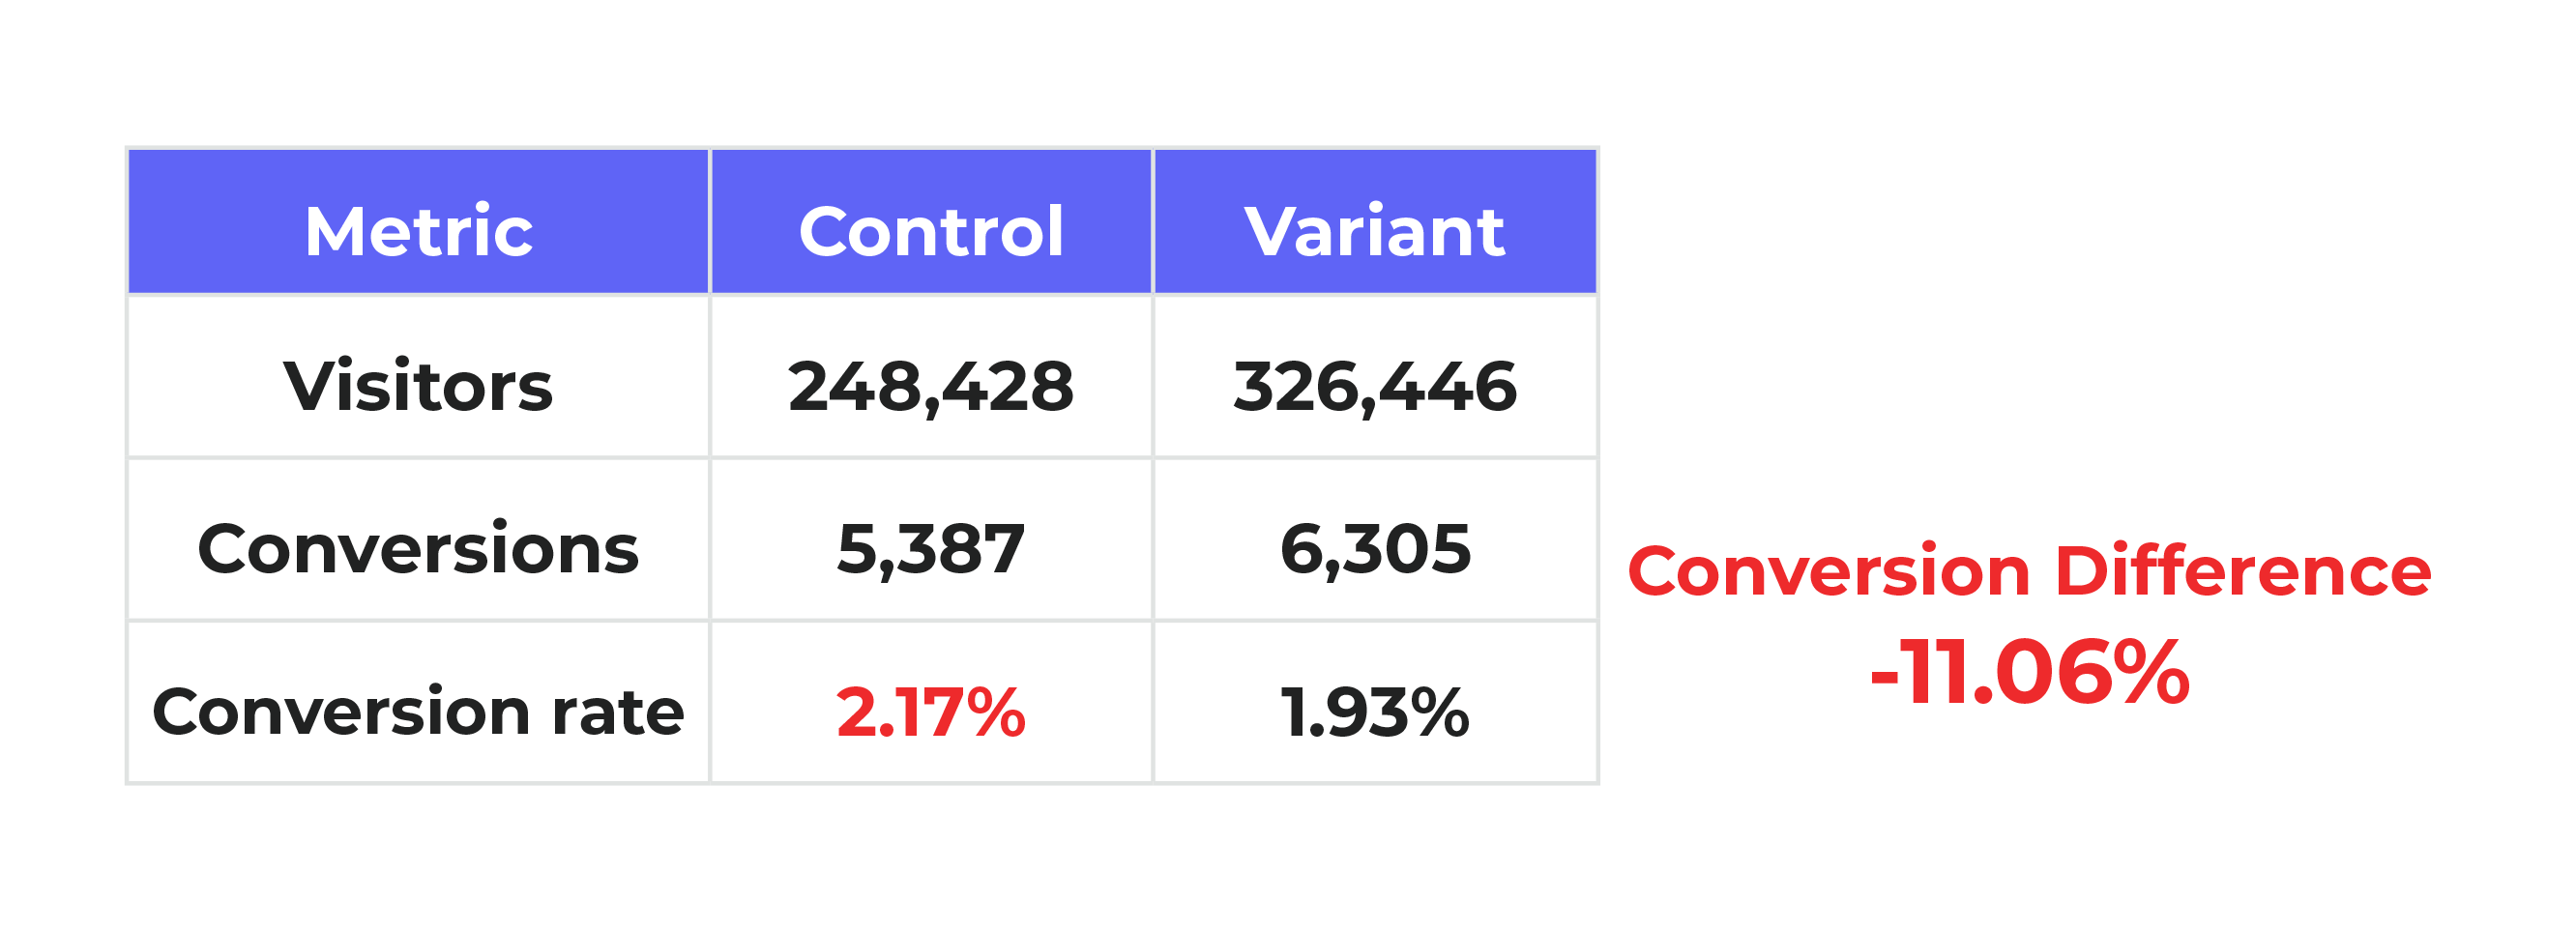
But, SRM ended up occurring and the variation received noticeably more users than the control:
The ratio of the traffic was clearly mismatched – even though it was supposed to be split evenly.
This finding was itself problematic.
But the real issue was that, because the sample was mismatched, the conversion rates were completely skewed.
Looking to increase leads, the SaaS platform found the control achieved 9,346 conversions, but the variation far outperformed with 18,733 conversions.
Conversion rate with SRM

Conversion rate with equally split traffic

However, had traffic been split evenly, using these same traffic and conversion numbers, the conversion lift would have amounted to a positive +17.11% gain, making the variant the winning version over the control:
The testing team was unsure what the real conversion uplift really was.
Compounding the problem, the team didn’t know if the losing variant occured because so much more traffic was exposed to it, or if the variation unperformed because it was indeed inferior.
The company was left in the dark. And couldn’t trust the results. Because of SRM, the test results were deemed useless. Based on this real-life example, you can see SRM is definitely something you want to avoid in your own testing practice. SRM skews test results and makes them untrustworthy.
How common is SRM?
This example is not an isolated one.
In fact, research shows, about 6-10% of all tests run end up with a SRM issue.
Kameleoon’s SRM rate is a bit below this industry average. Of all experiments run on Kameleoon, only about 5.5% have an SRM issue.
We’ve taken a lot of measures to catch SRM issues and pride ourselves on this lower SRM rate.
What causes SRM?
SRM can occur with samples of any size. However, the larger the sample, the more likely it is to be detected. No matter the sample size, there are over 40 potential reasons why SRM occurs. Most of the time, the issues relate to improper set-up of the test, bugs with randomization, or tracking and reporting issues. Not all problems are avoidable, but most are.
What can be done to avoid SRM?
The good news is, Kameleoon makes it very easy to check for, and avoid, SRM. Unlike many competing testing platforms, we pay attention to SRM for you, so you don’t have to!
How?
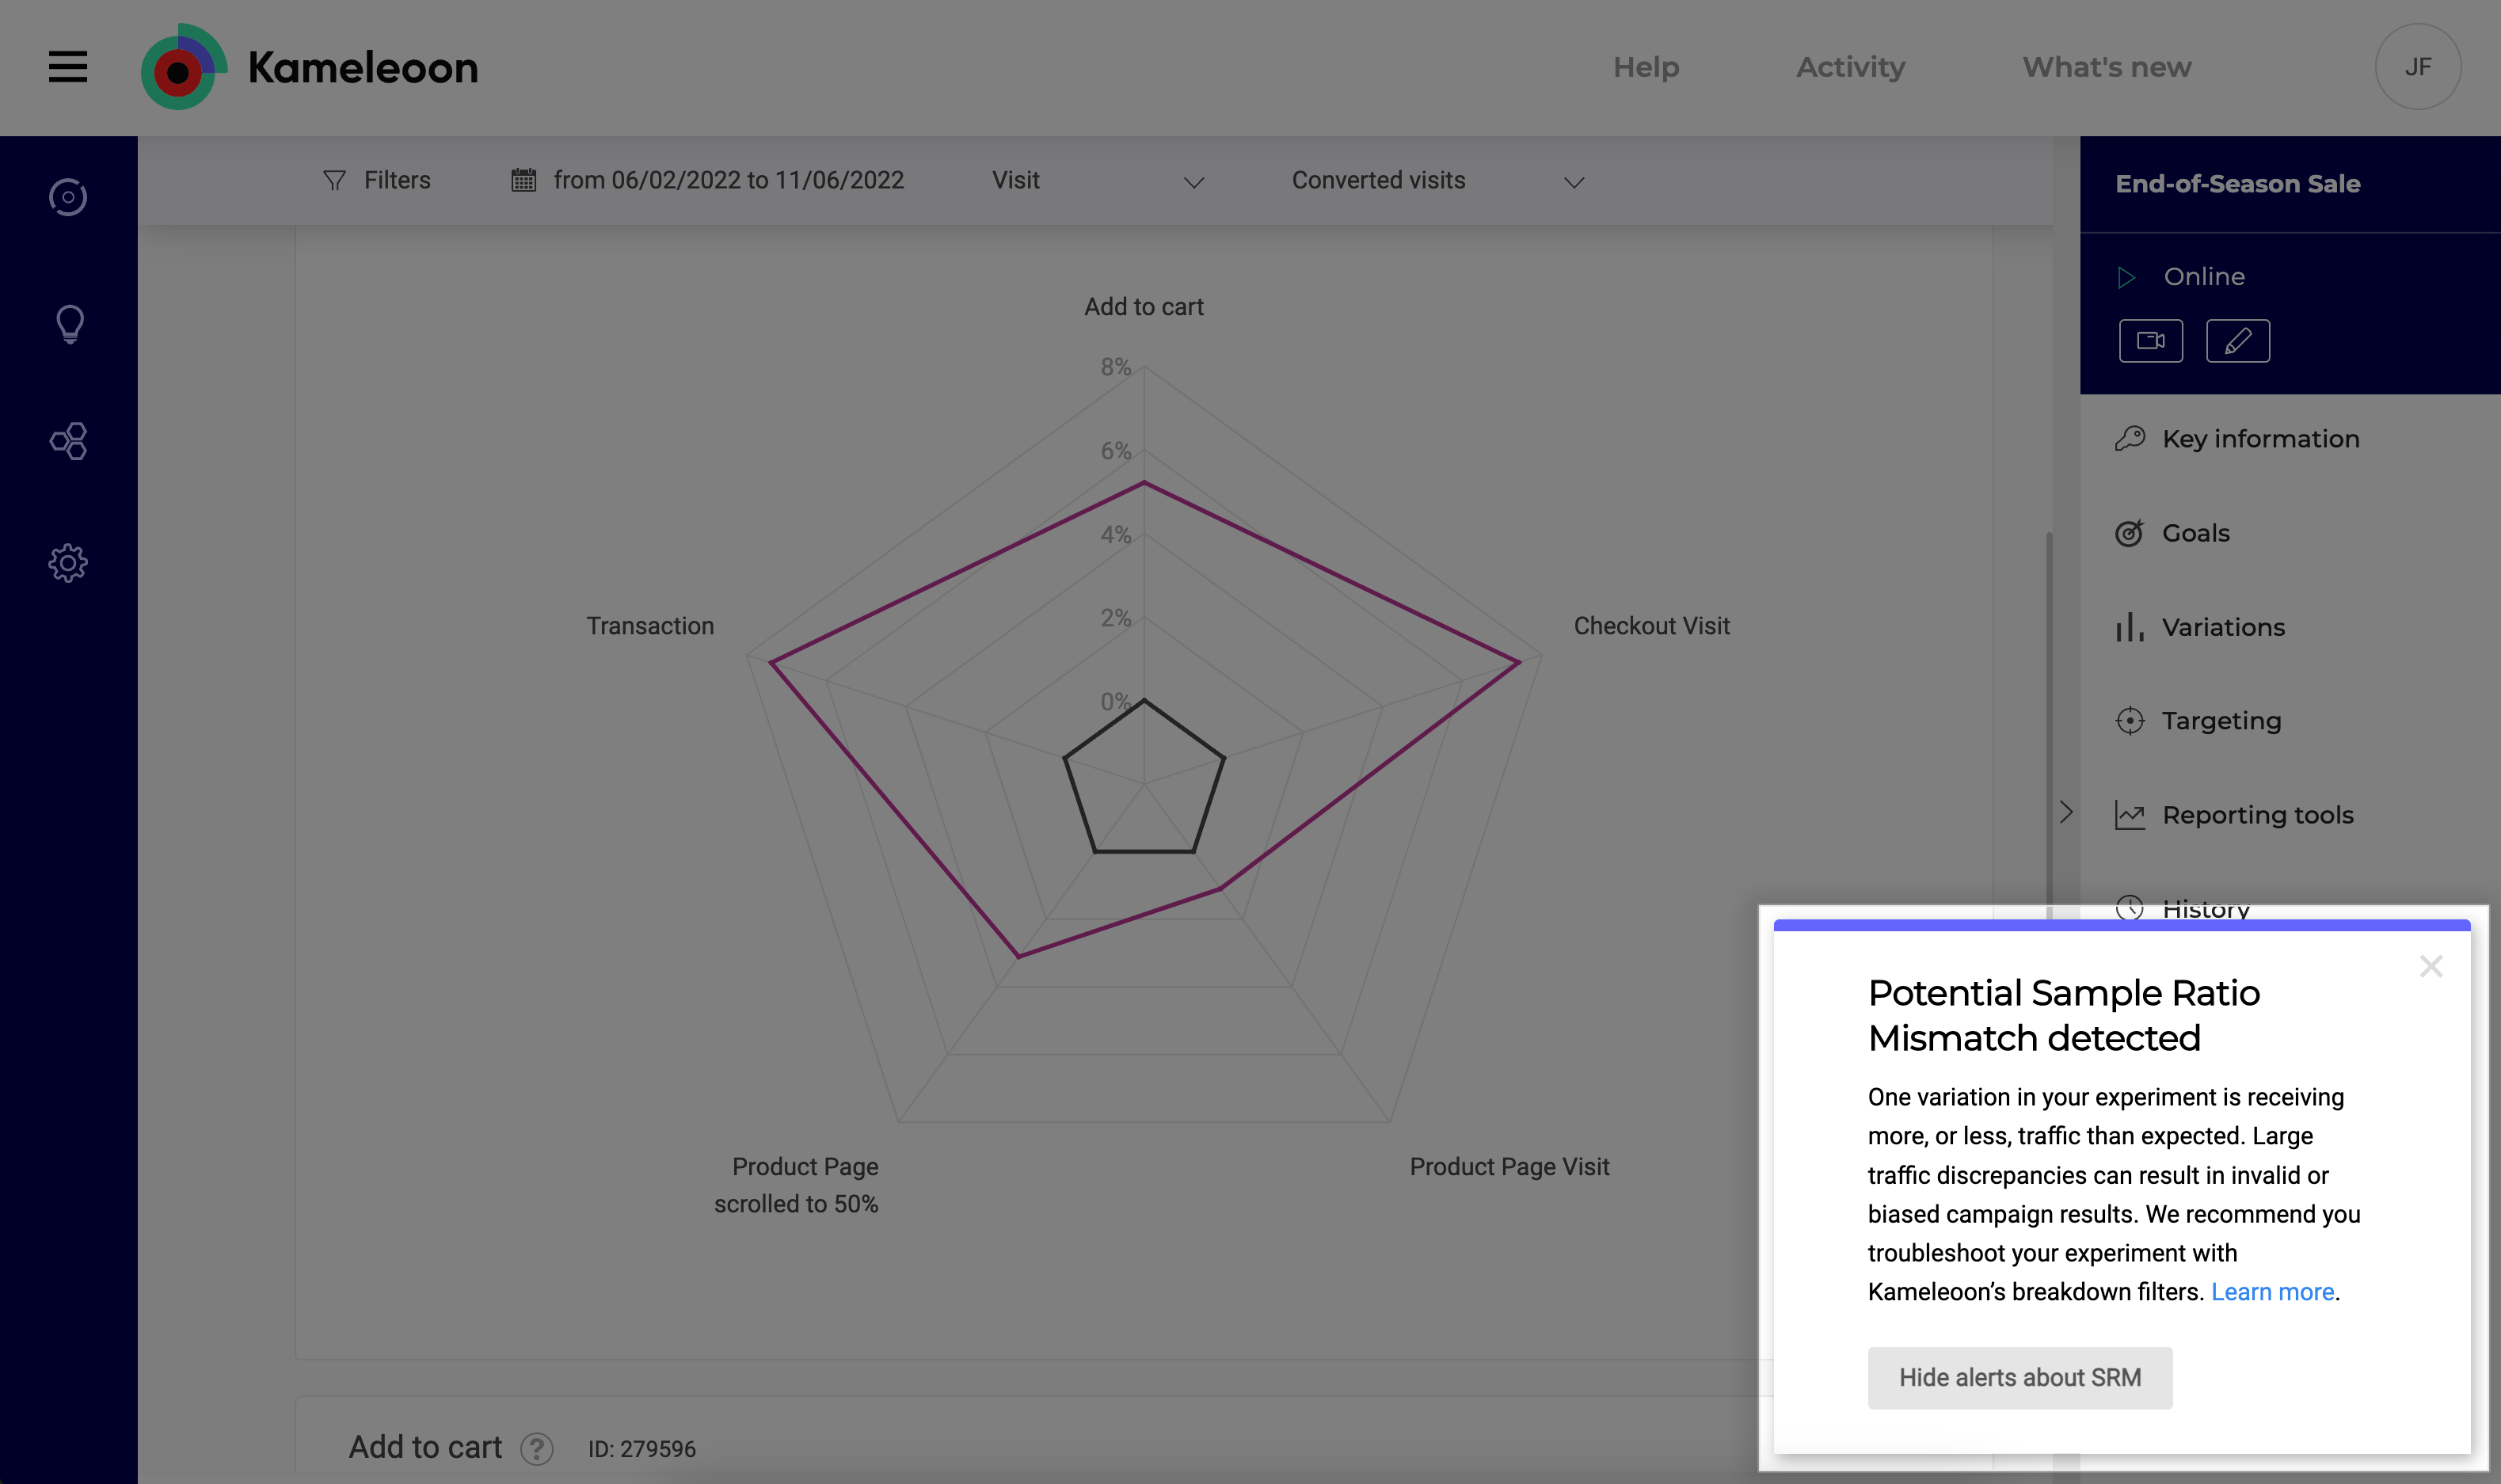
We’ve developed an in-app notification alert that displays on any test when SRM is suspected or detected. The notification sits on the bottom, right corner your results screen and looks like this:

So, when running your experiments, all you have to do is be on the lookout for any SRM alerts.
A quick note about traffic allocation and multi-armed bandit tests
The one exception is with tests using dynamic traffic allocation, also known as a multi-armed bandit approach.
With the multi-armed bandit methodology, traffic distribution starts off evenly, but is dynamically weighted towards the apparent winner as the test progresses.
While this re-allocation of traffic mid-test may sound like a SRM issue, a lot of complex statistical checkpoints are put in place to ensure a reliable outcome.
That said, because of the way traffic is dynamically allocated, it’s not easily possible to verify if there’s a SRM issue with multi-armed bandit tests.
Do’s and don’ts to avoid SRM
Assuming you’re not running a multi-armed bandit test, and you do receive an SRM alert, what should you do?
The answer is: keep calm and carry on.

In Kameleoon, there are certain things you can do – and should not do – to avoid the risk of SRM.
Here’s a useful checklist list for you:
✅ Keep an eye out for SRM in-app alerts, and pay attention to them if they occur.
✅ Checkout this help doc we’ve created for you to more easily diagnose SRM issues.
✅ Slice and dice your data to identify what might be causing the issue.
- Kameleoon’s in-app reports make it easy to apply filters and quickly see what might be causing the SRM issue
- To diagnose and filter, simply go to the Filter section, explore which traffic segment(s) might be problematic, and filter them out. Or re-run the experiment with that segment filtered out:
SRM Don’ts
❌ Update or reallocate traffic mid-test as it could contribute to SRM.
❌ Create cross device tracking or re-direct tests where Kameleoon isn’t installed. These types of tests are most prone to SRM, and without Kameleoon installed, they have a higher likelihood of being faulty.
❌ Develop custom variants or scripts that bypass Kameleoon’s platform. Doing so has a higher chance of resulting in SRM issues.
❌ Throw out the results of your experiment just because SRM occurred. As explained above, instead see if you can filter the problematic segment(s) of visitors and still draw valid conclusions from the remainder of the traffic.
❌ Ignore SRM notifications; they’re there to help keep your experiment on track.
❌ Implement or trust test results with a SRM issue – at least until you’ve diagnosed the root cause.
SRM summary
SRM occurs when one variant ends up with far more traffic routed to it than the other(s). If your tests fall victim to SRM, the results aren't as valid and trustworthy as they should be.
To make accurate, data-driven decisions, you need to check for SRM and attempt to remove, or filter out, any occurrences of it. Doing so could save you from implementing so-called "winning" tests that are actually big losers.
So, don’t be the biggest loser; pay attention to Kameleoon’s SRM in-app alerts, and attempt to remove and resolve SRM from your tests.
Hope this article has been helpful for you. Questions? Curious? We'd love to hear from you. Please reach us at product@kameleoon.com


