Personalization: Dynamic Traffic Allocation vs Predictive Algorithms
Last year we launched Kameleoon Predict™, a solution that embraces predictive machine learning algorithms to improve and scale up the personalization of your digital experience for each and every visitor.
This article explains the value of machine learning algorithms within personalization, and how this approach differs from alternative strategies such as dynamic traffic allocation, customer segmentation and A/B testing/experimentation.
I’ll outline the major difference - while machine learning algorithms are inherently people-centric, dynamic traffic allocation is a statistical approach which doesn’t take into account the interests and needs of individual visitors. This explains why machine learning algorithms drive greater engagement and higher conversion rates, making predictive approaches key to ensuring the success of personalization projects.
Dynamic traffic allocation vs predictive algorithms
Dynamic traffic allocation (or multi-armed bandit) is an approach that allows experimentation platforms to automatically manage traffic allocation based on the performance of each variant.
In this post, I would like to detail the main differences between the multi-armed bandit method and predictive algorithms by focusing on the value created by each for both marketers and visitors.
Let’s begin by using a simple example: a marketer in the media industry wants to test five different headlines for an in-depth article that will be featured on the home page. There is a good volume of traffic which means that each of the five headlines will be seen by millions of visitors every day before the article drops off the home page.
In this case, we could use several methodologies to deliver this experiment and maximize the number of views of our article.
1 Experimentation using an A/B/n testing methodology
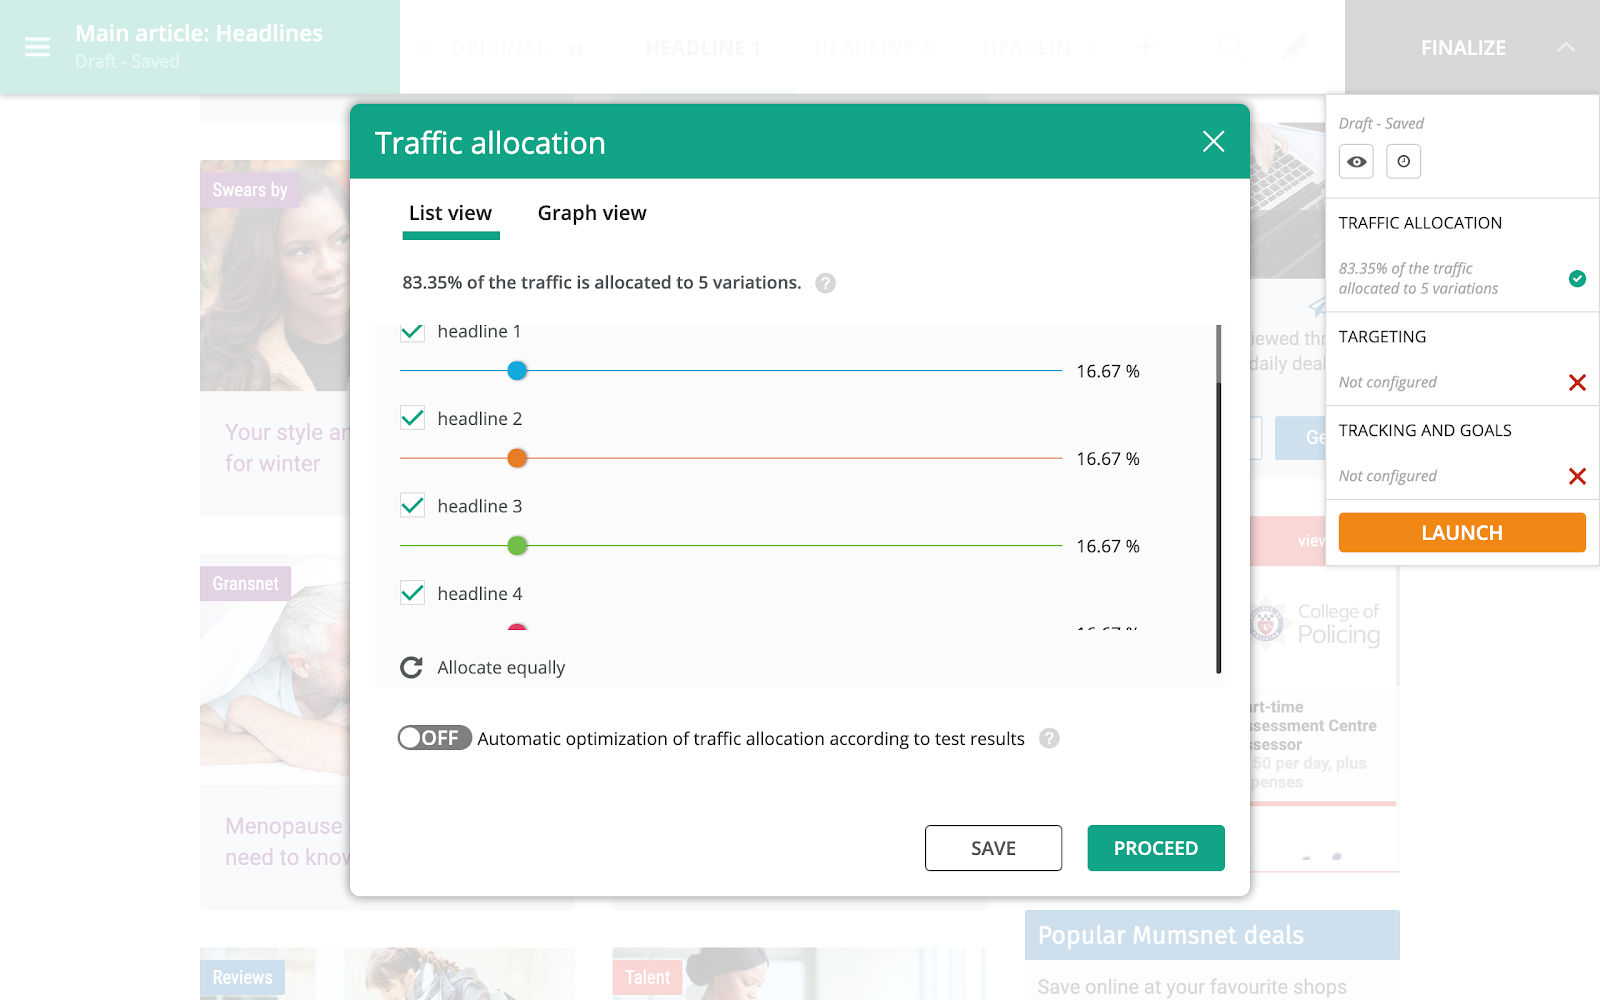
This is the traditional approach where we create our experiment with five variants (headlines). We let the A/B testing engine split traffic randomly between each variant, so that one-fifth of the total traffic on the home page sees each headline. Then, we let the experiment run for a few days and see which headline has the biggest traction in terms of driving numbers of views.
 Dashboard showing equal split of traffic with traditional A/B/n testing
The problem with this approach is that it will not leverage the huge amounts of data generated during the experiment in order to improve and optimize the traffic sent to each variant and therefore will not boost the total number of views, as many visitors will see the worst-performing headlines. This is where a multi-armed bandit approach can help.
2 The Multi-Armed Bandit Methodology
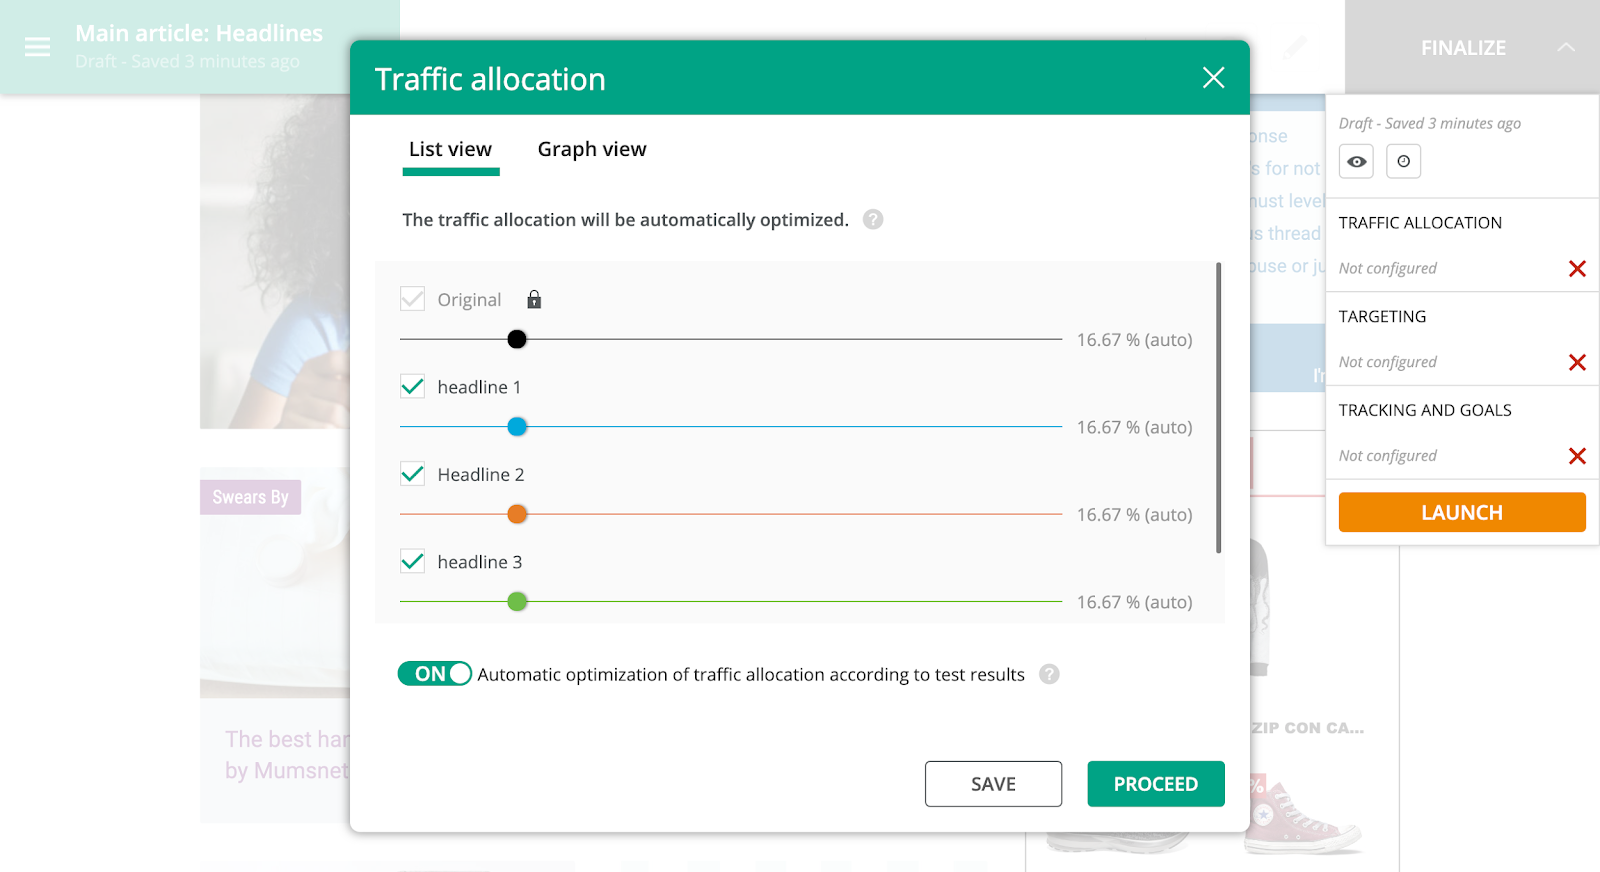
In this approach, traffic is first split randomly between each variant as in a classic A/B/n experiment. However, multi-armed bandit algorithms will then start moving the traffic between variants according to their performance during the experiment. This means that by the end we are showing the statistically best performing headline to all visitors.

Dashboard showing dynamic split of traffic optimized by performance through the multi-armed bandit methodology
The main advantage of this method is that it takes into account real-time data while the experiment runs to optimize performance against our main KPI (views of the article).
However, the limit of a multi-armed bandit approach is that it does not take into account the preferences of each individual visitor. Instead, this approach aims to maximize the performance of the headline based on global preferences and ignores individual choices or the particular needs of each visitor. So if a particular group prefers one headline over the others, yet this is not the majority view amongst all visitors, members of this group will be shown the globally most popular headline, not the one that is proven to appeal to their segment.
3 The segmentation/manual personalization methodology
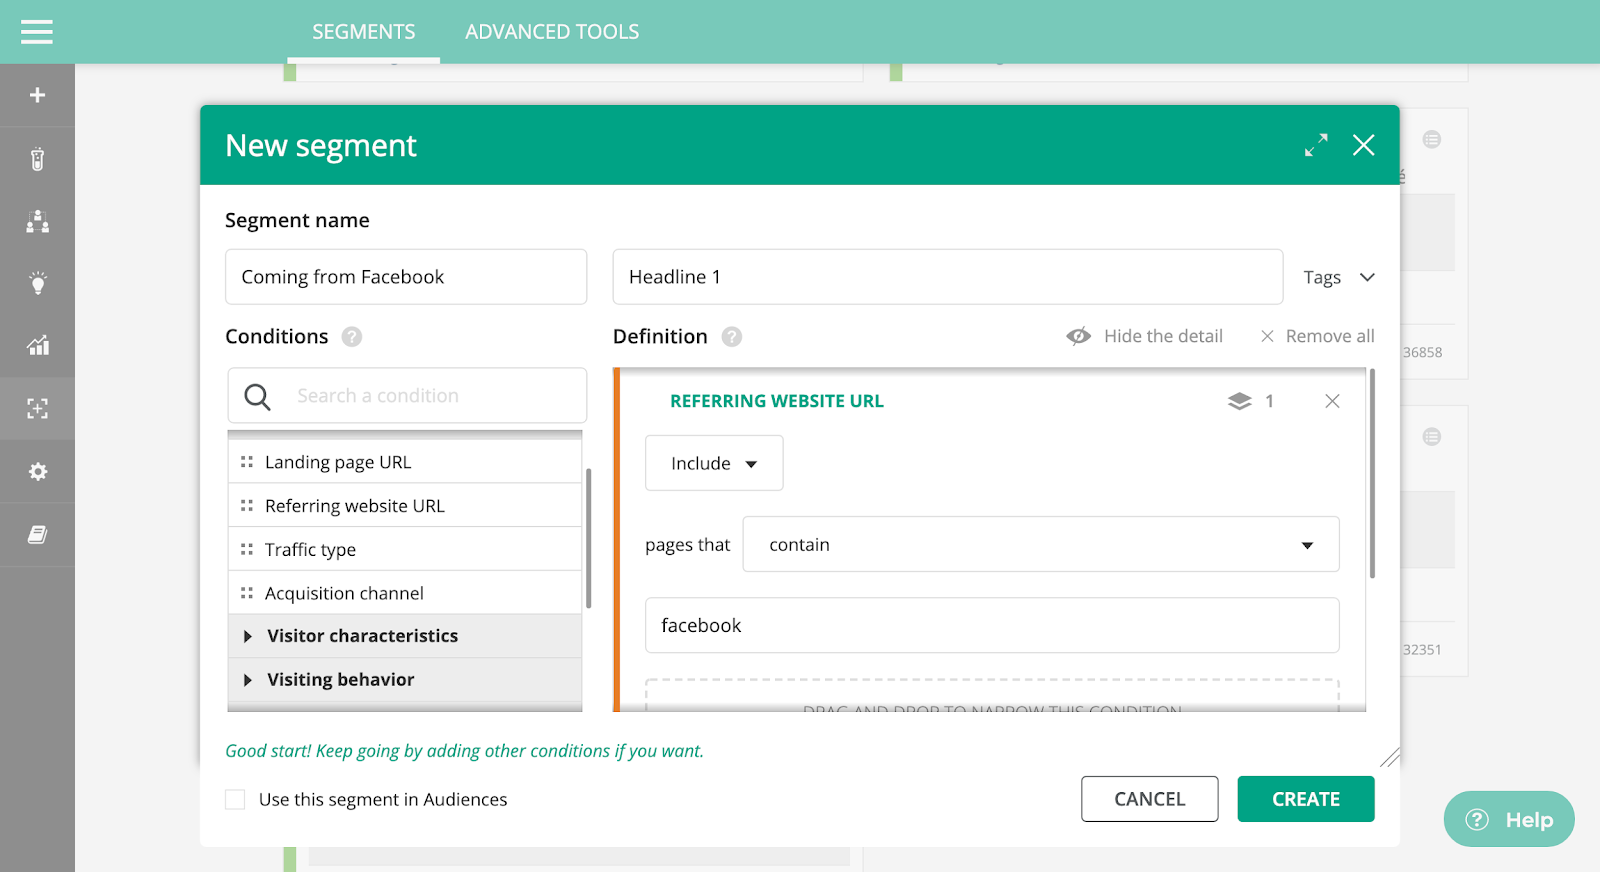
To overcome this, you can achieve a deeper level of optimization through manual segmentation/personalization that exposes different groups of visitors to different headlines. For instance, we may want visitors coming from Facebook to see the first headline and visitors from Twitter to see the second headline, or to deliver different headlines to readers from different geographical locations or using different devices.

While the multi-armed bandit method focuses on global statistics to maximize performance, manual segmentation takes into account the behavior and preferences of each visitor and uses this to assign them to a particular segment. It then displays the headline that meets the exact requirements of that visitor segment. While this makes a lot of sense in many cases it doesn’t scale very well, especially given our time constraints. Essentially, we won’t have enough time to analyze the performance of each segment and their preferences before our article drops from the home page after a few days. Consequently, we may end up guessing or using past data to create segments of visitors for each headline, with uncertain results. This is where using predictive algorithms can make a huge difference.
4 The predictive (automated) methodology
Predictive algorithms enable marketers and product teams to go beyond each of the previous approaches. The goal is still achieving the highest levels of performance against the KPI (in this case views of the article), but by taking into account every visitor’s needs and behavior in real-time. By relying on an incoming stream of behavioral and “hot” data (either historical or created during browsing), predictive algorithms find correlations between visitors and learn what behavior leads to an action on-site, in this case reading the article.
In our media use case, predictive algorithms can be a game-changer in comparison to all the other methodologies. They will automatically show the best headline to each visitor - i.e. the one that is statistically most likely to lead to them reading the article, thus driving optimal performance. The headline they see won’t be based on their segment or the overall most popular headline.

The Kameleoon Conversion Score (KCS)
The Kameleoon Conversion Score™ (KCS™) is an actionable, visible metric that provides a clear KPI for AI personalization.
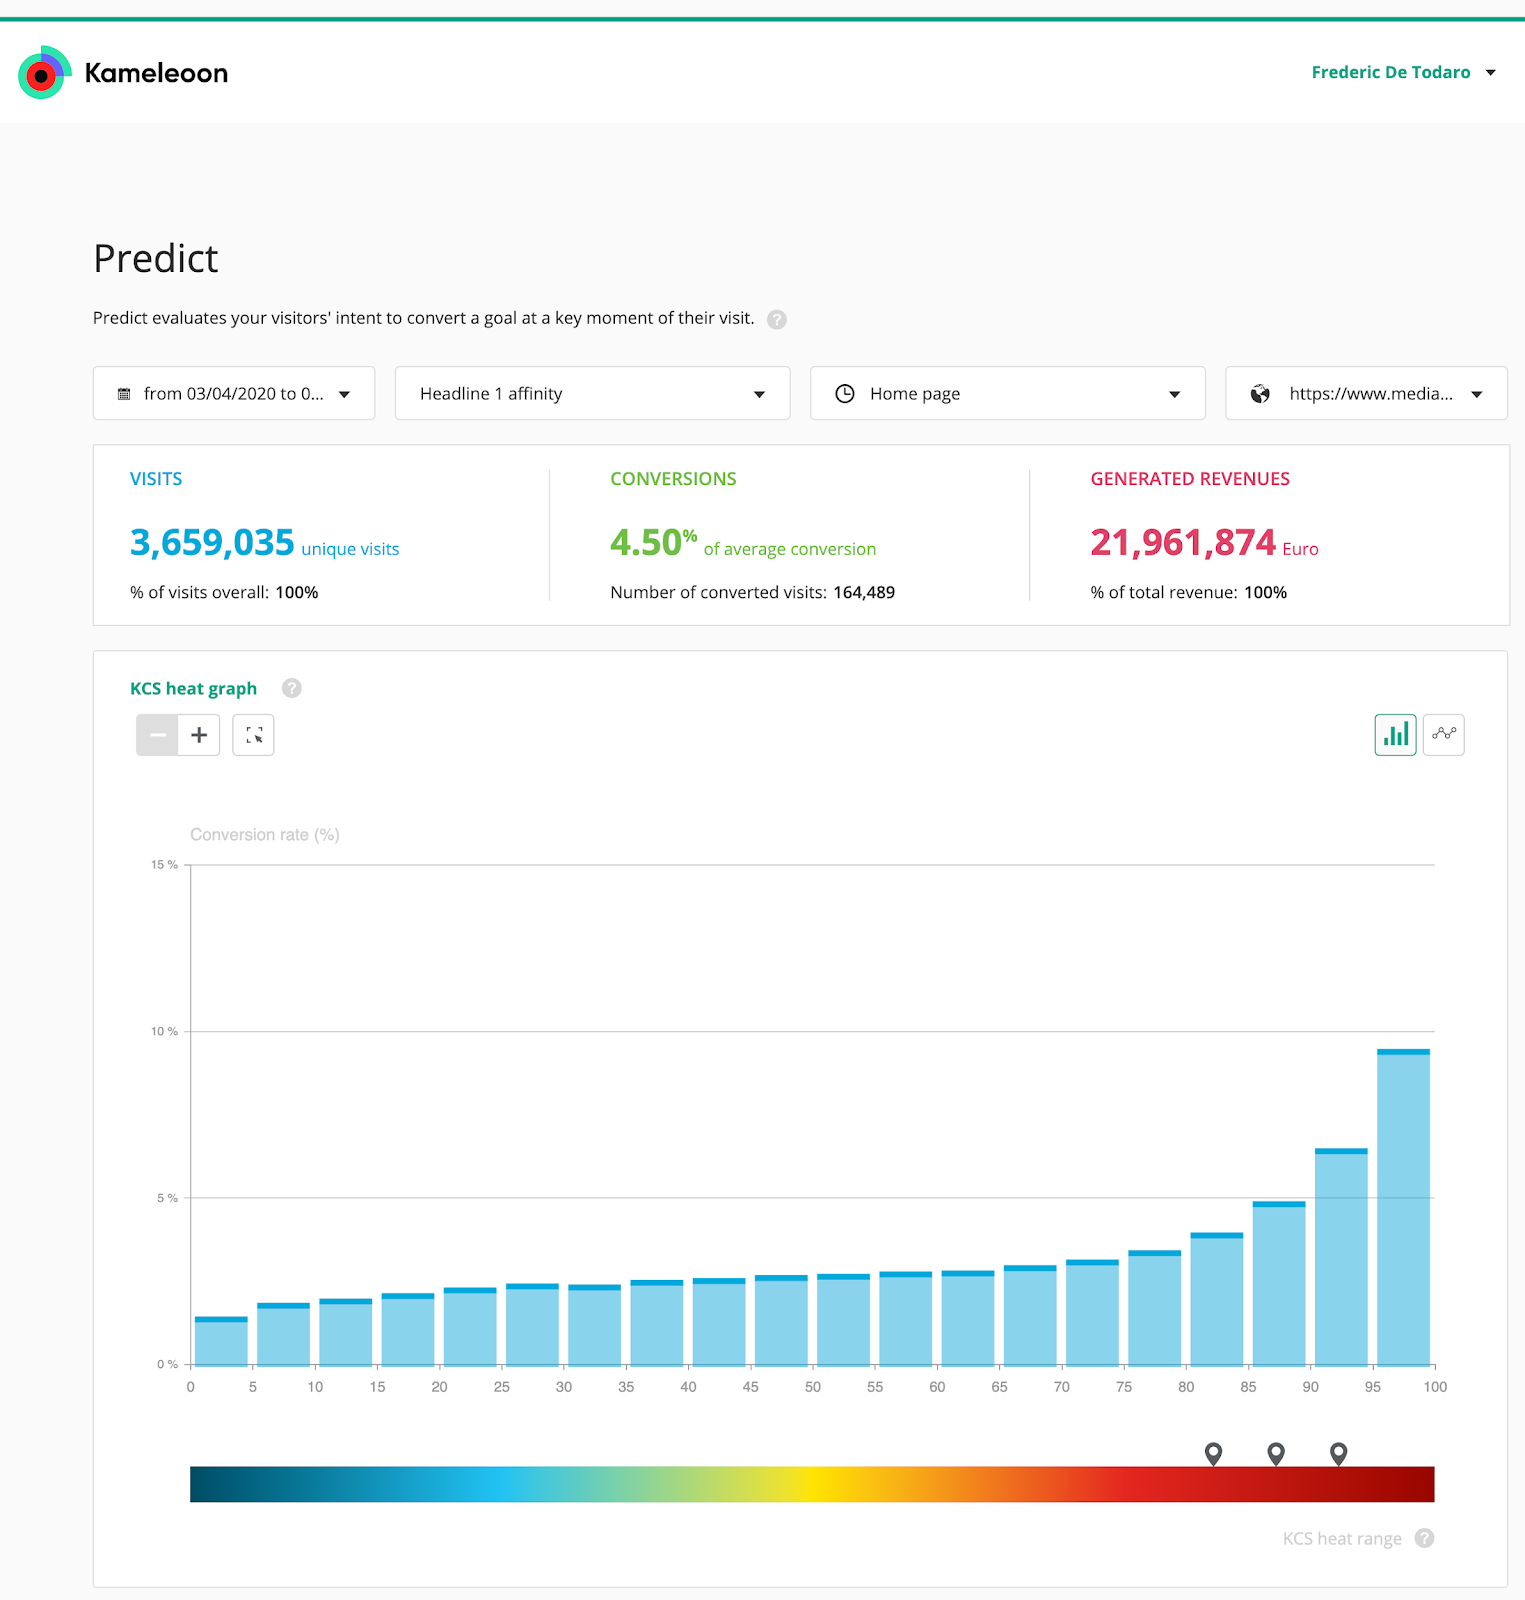
It works by calculating a score for every visitor in real-time, based on a scale of 1 to 100:
- A KCS of 1 means the visitor has the lowest chance to convert compared to other visitors.
- A KCS of 100 means that they have the highest chance of converting compared to other visitors.
The KCS is displayed as a conversion graph, color-coded from blue (low/cold) to red (high/hot). This makes it simple to understand, analyze and act upon. You can select a specific range and drill-down into it, and then use this to create a new segment to target.
The KCS provides a lot of data, but also helps marketers to understand it in business terms. Kameleoon automatically suggests the ranges with the greatest potential, marked with flags, identifying the biggest opportunities. These may not be the highest ranges (i.e. close to 100), which will convert anyway, but could be lower ranges that will deliver the greatest ROI. Essentially, the AI algorithm shows the opportunities, but you are in control of all actions, which you choose to pursue, and how you follow-up with specific segments.
In many cases, you could see predictive algorithms as being similar to multi-armed bandit algorithms, as both have the same end goal: achieving your conversion objective more quickly and efficiently. However, the philosophies behind them are polar opposites. While the multi-armed bandit approach focuses on dynamically delivering the best performing variation to all visitors, predictive algorithms instead learn what individual visitors are looking for in real-time in order to push the right content to them, driving deeper engagement and conversions from every visitor.
Predictive personalization provides a new way of delivering for business use cases, allowing marketers to offer real-time personalized content for specific visitors, instead of simply serving the content that statistically performs best for all visitors. Because of this, we believe that predictive algorithms will ultimately lead to more successful optimization initiatives.


