The 12 Kameleoon days of Christmas: part 6
We’ve seen a year of dramatic online change, with an acceleration of digital take-up driven by the pandemic and lockdowns. This has created new opportunities for brands, particularly as new groups go online for the first time. At the same time, it has also increased pressures on site infrastructure, potentially impacting performance.
Both these factors can have a knock-on effect on any experiments that you are running. If your website is not performing at 100% or external factors (such as Christmas) mean that the experience is different to normal, it will affect the reliability of your results. To overcome this Kameleoon allows you to easily set and remove particular time periods from your testing results.
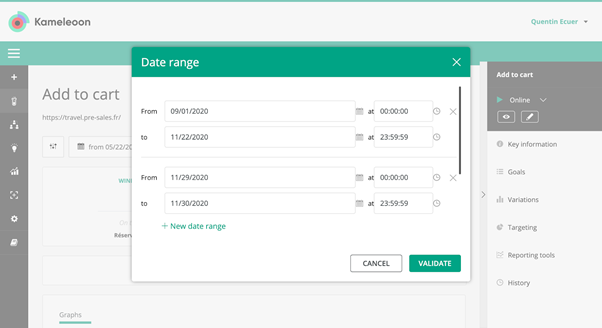
1 Ability to exclude a period of time from results
There are multiple times when your traffic and web performance may not be typical - such as if you are having technical problems, you suddenly have an influx of new user groups or you have higher than average volumes, such as around Black Friday or the holiday shopping season. This all impacts the reliability of your experimental results - meaning any decisions you take could be based on incorrect or inadequate data.
In many tools you need to manually export the data and remove these particular periods from your test data and then re-calculate overall results yourself. With Kameleoon you can quickly and simply set data ranges to exclude from test results - down to the second and minute. And you can also create multiple ranges to remove - and Kameleoon will automatically provide combined results. Learn more about the feature here.

As we move into the second half of our 12 part series, tomorrow we’ll be looking at the complex question of confidence stability in test results, and how the Kameleoon platform gives you the information you need to calculate this.

Read more in the series here:
- Day 1: Visualization of modified/tracked elements on a page
- Day 2: Reallocating traffic in case of issues
- Day 3: Simulation mode: visit and visitor generator
- Day 4: Click tracking: automatically send events to analytics tools such as Google Analytics
- Day 5: Adding a global code to an experiment
- Day 6: Excluding time periods from results
- Day 7: Measuring confidence stability
- Day 8: Switching to custom views
- Day 9: Using custom data for cross-device reconciliation
- Day 10: Personalization campaign management
- Day 11: Adding CSS selectors
- Day 12: Changing hover mode


